Immigrants from Indonesia vs Scandinavian 9th Grade
COMPARE
Immigrants from Indonesia
Scandinavian
9th Grade
9th Grade Comparison
Immigrants from Indonesia
Scandinavians
94.5%
9TH GRADE
12.3/ 100
METRIC RATING
211th/ 347
METRIC RANK
96.5%
9TH GRADE
100.0/ 100
METRIC RATING
18th/ 347
METRIC RANK
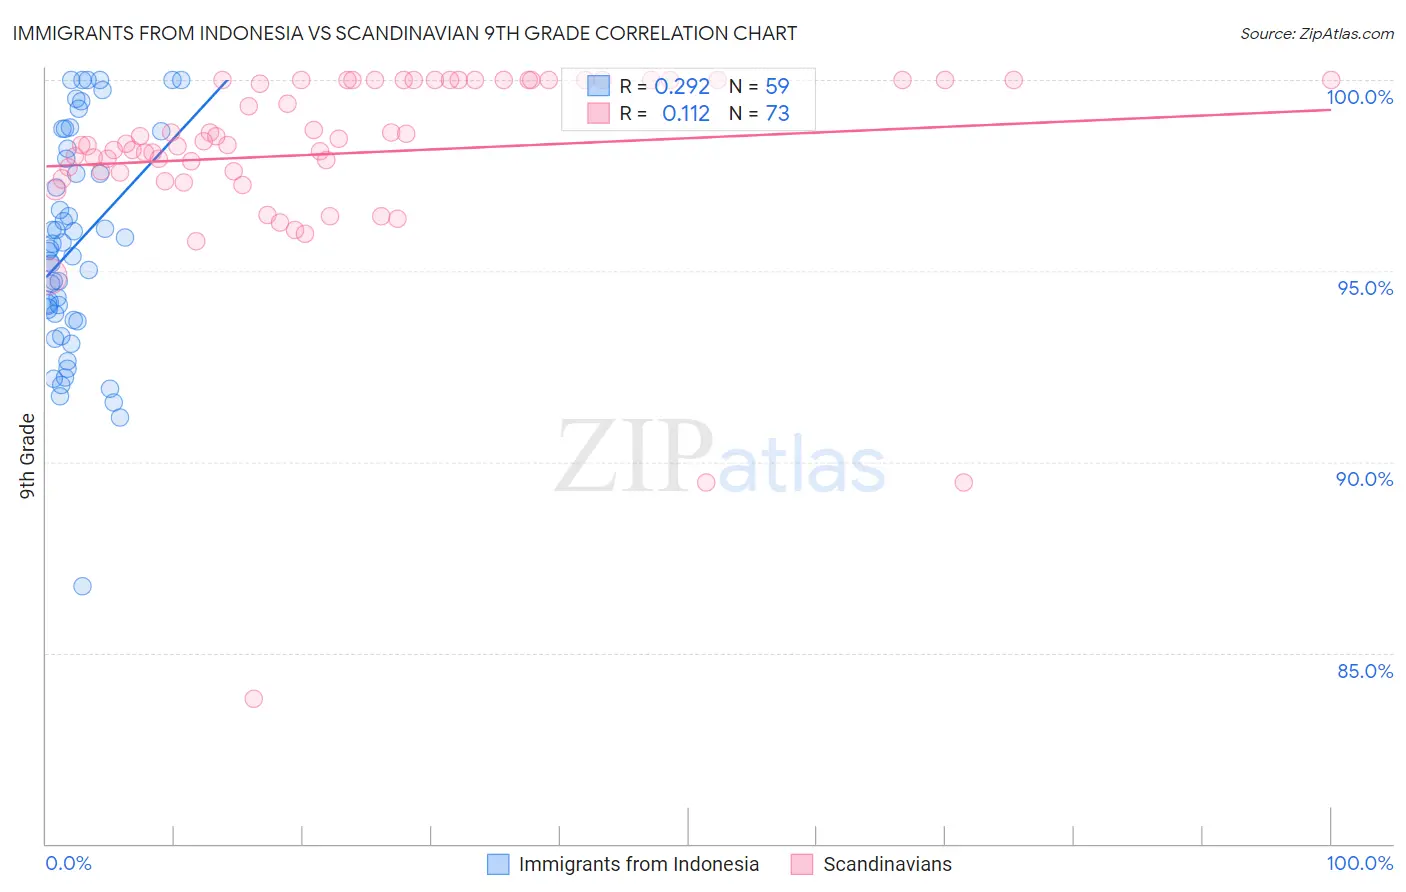
Immigrants from Indonesia vs Scandinavian 9th Grade Correlation Chart
The statistical analysis conducted on geographies consisting of 215,671,959 people shows a weak positive correlation between the proportion of Immigrants from Indonesia and percentage of population with at least 9th grade education in the United States with a correlation coefficient (R) of 0.292 and weighted average of 94.5%. Similarly, the statistical analysis conducted on geographies consisting of 472,660,435 people shows a poor positive correlation between the proportion of Scandinavians and percentage of population with at least 9th grade education in the United States with a correlation coefficient (R) of 0.112 and weighted average of 96.5%, a difference of 2.0%.
9th Grade Correlation Summary
| Measurement | Immigrants from Indonesia | Scandinavian |
| Minimum | 86.7% | 83.8% |
| Maximum | 100.0% | 100.0% |
| Range | 13.3% | 16.2% |
| Mean | 95.7% | 98.1% |
| Median | 95.6% | 98.3% |
| Interquartile 25% (IQ1) | 93.7% | 97.6% |
| Interquartile 75% (IQ3) | 98.2% | 100.0% |
| Interquartile Range (IQR) | 4.5% | 2.4% |
| Standard Deviation (Sample) | 2.9% | 2.6% |
| Standard Deviation (Population) | 2.9% | 2.6% |
Similar Demographics by 9th Grade
Demographics Similar to Immigrants from Indonesia by 9th Grade
In terms of 9th grade, the demographic groups most similar to Immigrants from Indonesia are Immigrants from Malaysia (94.5%, a difference of 0.0%), Immigrants from Oceania (94.5%, a difference of 0.0%), Immigrants from Liberia (94.5%, a difference of 0.010%), Immigrants from Chile (94.5%, a difference of 0.020%), and Immigrants from Syria (94.5%, a difference of 0.020%).
| Demographics | Rating | Rank | 9th Grade |
| Moroccans | 19.6 /100 | #204 | Poor 94.6% |
| Immigrants | Sudan | 17.6 /100 | #205 | Poor 94.6% |
| Samoans | 17.3 /100 | #206 | Poor 94.6% |
| Immigrants | Morocco | 16.3 /100 | #207 | Poor 94.6% |
| Immigrants | Pakistan | 15.5 /100 | #208 | Poor 94.6% |
| Comanche | 14.9 /100 | #209 | Poor 94.6% |
| Immigrants | Chile | 13.4 /100 | #210 | Poor 94.5% |
| Immigrants | Indonesia | 12.3 /100 | #211 | Poor 94.5% |
| Immigrants | Malaysia | 12.2 /100 | #212 | Poor 94.5% |
| Immigrants | Oceania | 12.1 /100 | #213 | Poor 94.5% |
| Immigrants | Liberia | 11.8 /100 | #214 | Poor 94.5% |
| Immigrants | Syria | 11.0 /100 | #215 | Poor 94.5% |
| Immigrants | Western Asia | 10.7 /100 | #216 | Poor 94.5% |
| Asians | 9.9 /100 | #217 | Tragic 94.5% |
| Portuguese | 9.2 /100 | #218 | Tragic 94.5% |
Demographics Similar to Scandinavians by 9th Grade
In terms of 9th grade, the demographic groups most similar to Scandinavians are Dutch (96.5%, a difference of 0.020%), Welsh (96.4%, a difference of 0.040%), Italian (96.4%, a difference of 0.040%), Alaskan Athabascan (96.4%, a difference of 0.050%), and European (96.4%, a difference of 0.060%).
| Demographics | Rating | Rank | 9th Grade |
| Finns | 100.0 /100 | #11 | Exceptional 96.6% |
| English | 100.0 /100 | #12 | Exceptional 96.6% |
| Danes | 100.0 /100 | #13 | Exceptional 96.5% |
| Scottish | 100.0 /100 | #14 | Exceptional 96.5% |
| Irish | 100.0 /100 | #15 | Exceptional 96.5% |
| Croatians | 100.0 /100 | #16 | Exceptional 96.5% |
| Dutch | 100.0 /100 | #17 | Exceptional 96.5% |
| Scandinavians | 100.0 /100 | #18 | Exceptional 96.5% |
| Welsh | 100.0 /100 | #19 | Exceptional 96.4% |
| Italians | 100.0 /100 | #20 | Exceptional 96.4% |
| Alaskan Athabascans | 100.0 /100 | #21 | Exceptional 96.4% |
| Europeans | 100.0 /100 | #22 | Exceptional 96.4% |
| Czechs | 100.0 /100 | #23 | Exceptional 96.4% |
| Latvians | 100.0 /100 | #24 | Exceptional 96.4% |
| French | 100.0 /100 | #25 | Exceptional 96.3% |