Moroccan vs Barbadian 9th Grade
COMPARE
Moroccan
Barbadian
9th Grade
9th Grade Comparison
Moroccans
Barbadians
94.6%
9TH GRADE
19.6/ 100
METRIC RATING
204th/ 347
METRIC RANK
93.5%
9TH GRADE
0.0/ 100
METRIC RATING
283rd/ 347
METRIC RANK
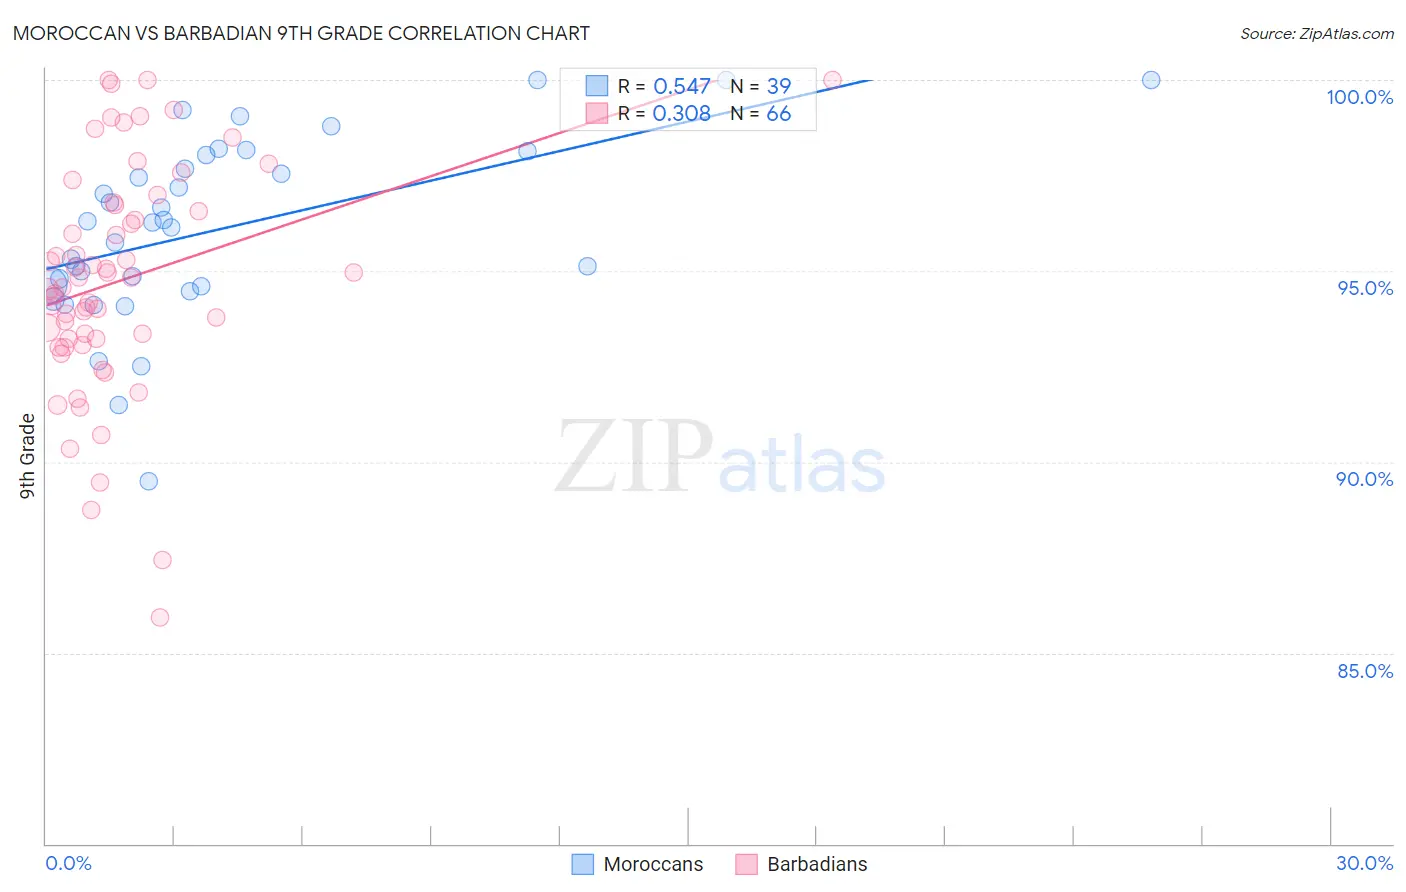
Moroccan vs Barbadian 9th Grade Correlation Chart
The statistical analysis conducted on geographies consisting of 201,817,667 people shows a substantial positive correlation between the proportion of Moroccans and percentage of population with at least 9th grade education in the United States with a correlation coefficient (R) of 0.547 and weighted average of 94.6%. Similarly, the statistical analysis conducted on geographies consisting of 141,304,456 people shows a mild positive correlation between the proportion of Barbadians and percentage of population with at least 9th grade education in the United States with a correlation coefficient (R) of 0.308 and weighted average of 93.5%, a difference of 1.2%.
9th Grade Correlation Summary
| Measurement | Moroccan | Barbadian |
| Minimum | 89.5% | 85.9% |
| Maximum | 100.0% | 100.0% |
| Range | 10.5% | 14.1% |
| Mean | 96.1% | 94.7% |
| Median | 96.3% | 94.7% |
| Interquartile 25% (IQ1) | 94.6% | 93.2% |
| Interquartile 75% (IQ3) | 98.0% | 96.7% |
| Interquartile Range (IQR) | 3.4% | 3.5% |
| Standard Deviation (Sample) | 2.4% | 3.0% |
| Standard Deviation (Population) | 2.4% | 3.0% |
Similar Demographics by 9th Grade
Demographics Similar to Moroccans by 9th Grade
In terms of 9th grade, the demographic groups most similar to Moroccans are Immigrants from Eastern Asia (94.6%, a difference of 0.0%), Immigrants from Bahamas (94.6%, a difference of 0.0%), Immigrants from Zaire (94.6%, a difference of 0.010%), Black/African American (94.6%, a difference of 0.010%), and Laotian (94.6%, a difference of 0.020%).
| Demographics | Rating | Rank | 9th Grade |
| Immigrants | Micronesia | 24.7 /100 | #197 | Fair 94.7% |
| Hawaiians | 22.7 /100 | #198 | Fair 94.7% |
| Laotians | 21.0 /100 | #199 | Fair 94.6% |
| Immigrants | Zaire | 20.6 /100 | #200 | Fair 94.6% |
| Blacks/African Americans | 20.5 /100 | #201 | Fair 94.6% |
| Immigrants | Eastern Asia | 19.8 /100 | #202 | Poor 94.6% |
| Immigrants | Bahamas | 19.8 /100 | #203 | Poor 94.6% |
| Moroccans | 19.6 /100 | #204 | Poor 94.6% |
| Immigrants | Sudan | 17.6 /100 | #205 | Poor 94.6% |
| Samoans | 17.3 /100 | #206 | Poor 94.6% |
| Immigrants | Morocco | 16.3 /100 | #207 | Poor 94.6% |
| Immigrants | Pakistan | 15.5 /100 | #208 | Poor 94.6% |
| Comanche | 14.9 /100 | #209 | Poor 94.6% |
| Immigrants | Chile | 13.4 /100 | #210 | Poor 94.5% |
| Immigrants | Indonesia | 12.3 /100 | #211 | Poor 94.5% |
Demographics Similar to Barbadians by 9th Grade
In terms of 9th grade, the demographic groups most similar to Barbadians are Malaysian (93.5%, a difference of 0.020%), Immigrants from Trinidad and Tobago (93.6%, a difference of 0.070%), Bangladeshi (93.4%, a difference of 0.070%), Taiwanese (93.6%, a difference of 0.11%), and Immigrants from Peru (93.4%, a difference of 0.11%).
| Demographics | Rating | Rank | 9th Grade |
| West Indians | 0.2 /100 | #276 | Tragic 93.7% |
| Immigrants | Philippines | 0.1 /100 | #277 | Tragic 93.7% |
| Immigrants | Eritrea | 0.1 /100 | #278 | Tragic 93.7% |
| Trinidadians and Tobagonians | 0.1 /100 | #279 | Tragic 93.7% |
| Taiwanese | 0.1 /100 | #280 | Tragic 93.6% |
| Immigrants | Trinidad and Tobago | 0.1 /100 | #281 | Tragic 93.6% |
| Malaysians | 0.0 /100 | #282 | Tragic 93.5% |
| Barbadians | 0.0 /100 | #283 | Tragic 93.5% |
| Bangladeshis | 0.0 /100 | #284 | Tragic 93.4% |
| Immigrants | Peru | 0.0 /100 | #285 | Tragic 93.4% |
| Immigrants | Barbados | 0.0 /100 | #286 | Tragic 93.4% |
| Immigrants | St. Vincent and the Grenadines | 0.0 /100 | #287 | Tragic 93.4% |
| Immigrants | South Eastern Asia | 0.0 /100 | #288 | Tragic 93.3% |
| Immigrants | West Indies | 0.0 /100 | #289 | Tragic 93.3% |
| Pennsylvania Germans | 0.0 /100 | #290 | Tragic 93.3% |