Immigrants from Central America vs Cape Verdean Professional Degree
COMPARE
Immigrants from Central America
Cape Verdean
Professional Degree
Professional Degree Comparison
Immigrants from Central America
Cape Verdeans
2.9%
PROFESSIONAL DEGREE
0.0/ 100
METRIC RATING
339th/ 347
METRIC RANK
3.4%
PROFESSIONAL DEGREE
0.1/ 100
METRIC RATING
306th/ 347
METRIC RANK
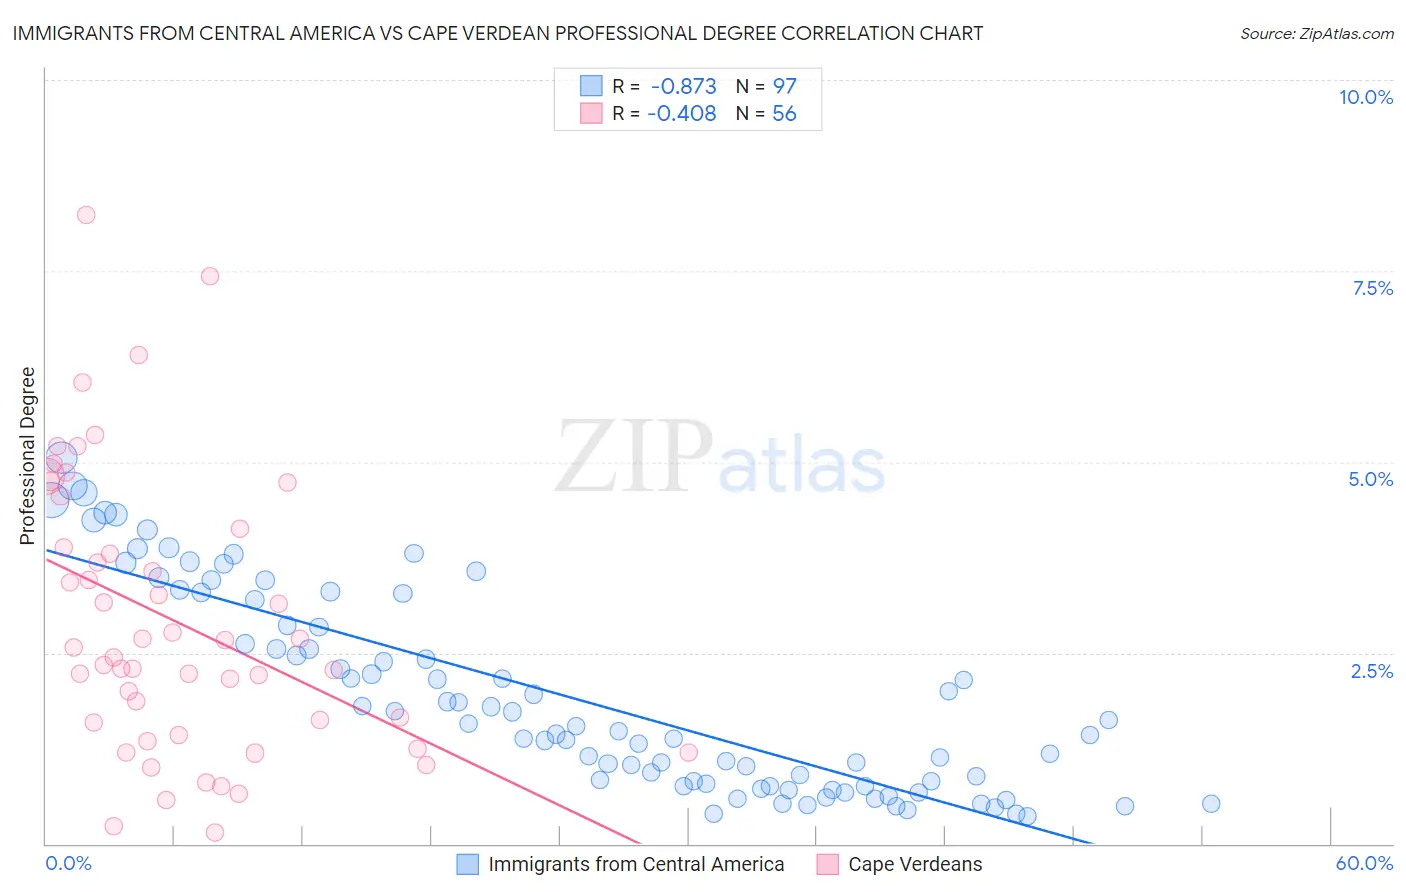
Immigrants from Central America vs Cape Verdean Professional Degree Correlation Chart
The statistical analysis conducted on geographies consisting of 530,794,106 people shows a very strong negative correlation between the proportion of Immigrants from Central America and percentage of population with at least professional degree education in the United States with a correlation coefficient (R) of -0.873 and weighted average of 2.9%. Similarly, the statistical analysis conducted on geographies consisting of 107,527,717 people shows a moderate negative correlation between the proportion of Cape Verdeans and percentage of population with at least professional degree education in the United States with a correlation coefficient (R) of -0.408 and weighted average of 3.4%, a difference of 17.1%.
Professional Degree Correlation Summary
| Measurement | Immigrants from Central America | Cape Verdean |
| Minimum | 0.36% | 0.14% |
| Maximum | 5.1% | 8.2% |
| Range | 4.7% | 8.1% |
| Mean | 1.9% | 2.9% |
| Median | 1.5% | 2.5% |
| Interquartile 25% (IQ1) | 0.78% | 1.5% |
| Interquartile 75% (IQ3) | 3.0% | 4.0% |
| Interquartile Range (IQR) | 2.3% | 2.5% |
| Standard Deviation (Sample) | 1.3% | 1.8% |
| Standard Deviation (Population) | 1.3% | 1.8% |
Similar Demographics by Professional Degree
Demographics Similar to Immigrants from Central America by Professional Degree
In terms of professional degree, the demographic groups most similar to Immigrants from Central America are Yup'ik (2.9%, a difference of 0.050%), Navajo (2.9%, a difference of 0.12%), Arapaho (2.9%, a difference of 0.19%), Tohono O'odham (2.8%, a difference of 0.83%), and Immigrants from the Azores (2.8%, a difference of 1.5%).
| Demographics | Rating | Rank | Professional Degree |
| Yakama | 0.0 /100 | #332 | Tragic 3.1% |
| Puget Sound Salish | 0.0 /100 | #333 | Tragic 3.1% |
| Pennsylvania Germans | 0.0 /100 | #334 | Tragic 3.0% |
| Natives/Alaskans | 0.0 /100 | #335 | Tragic 3.0% |
| Fijians | 0.0 /100 | #336 | Tragic 2.9% |
| Arapaho | 0.0 /100 | #337 | Tragic 2.9% |
| Navajo | 0.0 /100 | #338 | Tragic 2.9% |
| Immigrants | Central America | 0.0 /100 | #339 | Tragic 2.9% |
| Yup'ik | 0.0 /100 | #340 | Tragic 2.9% |
| Tohono O'odham | 0.0 /100 | #341 | Tragic 2.8% |
| Immigrants | Azores | 0.0 /100 | #342 | Tragic 2.8% |
| Mexicans | 0.0 /100 | #343 | Tragic 2.7% |
| Spanish American Indians | 0.0 /100 | #344 | Tragic 2.7% |
| Immigrants | Mexico | 0.0 /100 | #345 | Tragic 2.6% |
| Lumbee | 0.0 /100 | #346 | Tragic 2.5% |
Demographics Similar to Cape Verdeans by Professional Degree
In terms of professional degree, the demographic groups most similar to Cape Verdeans are Chickasaw (3.4%, a difference of 0.010%), Cajun (3.4%, a difference of 0.31%), Immigrants from Haiti (3.4%, a difference of 0.32%), Malaysian (3.4%, a difference of 0.98%), and Samoan (3.3%, a difference of 1.1%).
| Demographics | Rating | Rank | Professional Degree |
| Immigrants | Yemen | 0.2 /100 | #299 | Tragic 3.4% |
| Blacks/African Americans | 0.2 /100 | #300 | Tragic 3.4% |
| Immigrants | Dominican Republic | 0.2 /100 | #301 | Tragic 3.4% |
| Malaysians | 0.2 /100 | #302 | Tragic 3.4% |
| Immigrants | Haiti | 0.2 /100 | #303 | Tragic 3.4% |
| Cajuns | 0.2 /100 | #304 | Tragic 3.4% |
| Chickasaw | 0.1 /100 | #305 | Tragic 3.4% |
| Cape Verdeans | 0.1 /100 | #306 | Tragic 3.4% |
| Samoans | 0.1 /100 | #307 | Tragic 3.3% |
| Shoshone | 0.1 /100 | #308 | Tragic 3.3% |
| Pima | 0.1 /100 | #309 | Tragic 3.3% |
| Immigrants | Latin America | 0.1 /100 | #310 | Tragic 3.3% |
| Cherokee | 0.1 /100 | #311 | Tragic 3.3% |
| Sioux | 0.1 /100 | #312 | Tragic 3.3% |
| Yuman | 0.1 /100 | #313 | Tragic 3.3% |