Tsimshian vs Iranian High School Diploma
COMPARE
Tsimshian
Iranian
High School Diploma
High School Diploma Comparison
Tsimshian
Iranians
91.3%
HIGH SCHOOL DIPLOMA
99.9/ 100
METRIC RATING
36th/ 347
METRIC RANK
91.4%
HIGH SCHOOL DIPLOMA
99.9/ 100
METRIC RATING
30th/ 347
METRIC RANK
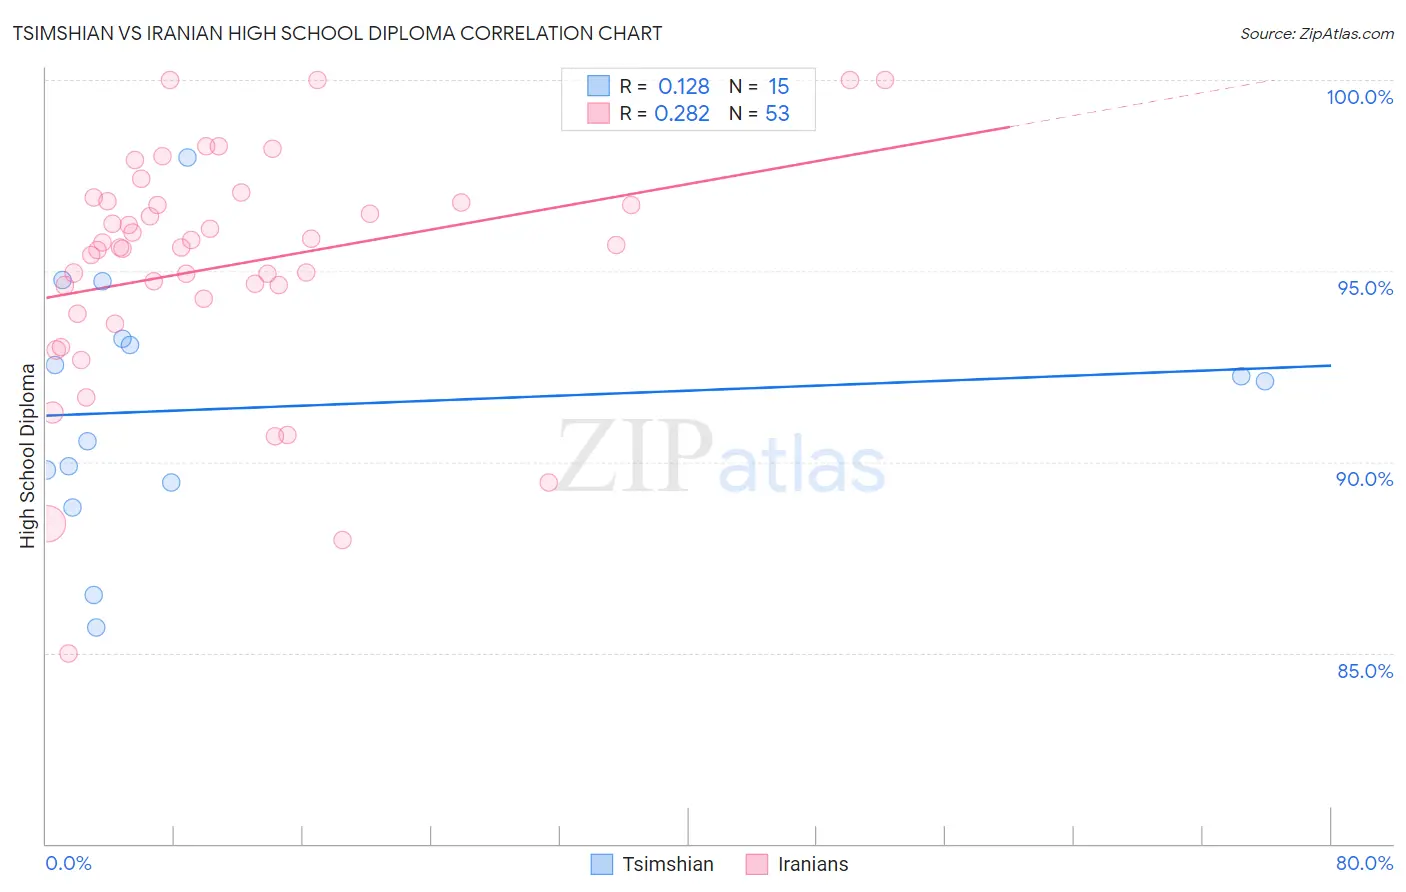
Tsimshian vs Iranian High School Diploma Correlation Chart
The statistical analysis conducted on geographies consisting of 15,626,544 people shows a poor positive correlation between the proportion of Tsimshian and percentage of population with at least high school diploma education in the United States with a correlation coefficient (R) of 0.128 and weighted average of 91.3%. Similarly, the statistical analysis conducted on geographies consisting of 316,901,778 people shows a weak positive correlation between the proportion of Iranians and percentage of population with at least high school diploma education in the United States with a correlation coefficient (R) of 0.282 and weighted average of 91.4%, a difference of 0.080%.
High School Diploma Correlation Summary
| Measurement | Tsimshian | Iranian |
| Minimum | 85.7% | 85.0% |
| Maximum | 98.0% | 100.0% |
| Range | 12.3% | 15.0% |
| Mean | 91.4% | 95.1% |
| Median | 92.1% | 95.6% |
| Interquartile 25% (IQ1) | 89.5% | 94.1% |
| Interquartile 75% (IQ3) | 93.2% | 96.8% |
| Interquartile Range (IQR) | 3.8% | 2.7% |
| Standard Deviation (Sample) | 3.2% | 3.1% |
| Standard Deviation (Population) | 3.1% | 3.0% |
Demographics Similar to Tsimshian and Iranians by High School Diploma
In terms of high school diploma, the demographic groups most similar to Tsimshian are Immigrants from Ireland (91.3%, a difference of 0.020%), Irish (91.4%, a difference of 0.030%), Immigrants from Scotland (91.3%, a difference of 0.040%), Dutch (91.3%, a difference of 0.050%), and Okinawan (91.4%, a difference of 0.060%). Similarly, the demographic groups most similar to Iranians are European (91.4%, a difference of 0.010%), Immigrants from Northern Europe (91.4%, a difference of 0.010%), English (91.4%, a difference of 0.010%), Okinawan (91.4%, a difference of 0.010%), and Scottish (91.4%, a difference of 0.020%).
| Demographics | Rating | Rank | High School Diploma |
| Scandinavians | 99.9 /100 | #23 | Exceptional 91.5% |
| Italians | 99.9 /100 | #24 | Exceptional 91.5% |
| Thais | 99.9 /100 | #25 | Exceptional 91.5% |
| Russians | 99.9 /100 | #26 | Exceptional 91.5% |
| Cypriots | 99.9 /100 | #27 | Exceptional 91.5% |
| Tlingit-Haida | 99.9 /100 | #28 | Exceptional 91.4% |
| Europeans | 99.9 /100 | #29 | Exceptional 91.4% |
| Iranians | 99.9 /100 | #30 | Exceptional 91.4% |
| Immigrants | Northern Europe | 99.9 /100 | #31 | Exceptional 91.4% |
| English | 99.9 /100 | #32 | Exceptional 91.4% |
| Okinawans | 99.9 /100 | #33 | Exceptional 91.4% |
| Scottish | 99.9 /100 | #34 | Exceptional 91.4% |
| Irish | 99.9 /100 | #35 | Exceptional 91.4% |
| Tsimshian | 99.9 /100 | #36 | Exceptional 91.3% |
| Immigrants | Ireland | 99.9 /100 | #37 | Exceptional 91.3% |
| Immigrants | Scotland | 99.8 /100 | #38 | Exceptional 91.3% |
| Dutch | 99.8 /100 | #39 | Exceptional 91.3% |
| Immigrants | Lithuania | 99.8 /100 | #40 | Exceptional 91.3% |
| Immigrants | Australia | 99.8 /100 | #41 | Exceptional 91.3% |
| Northern Europeans | 99.8 /100 | #42 | Exceptional 91.3% |
| British | 99.8 /100 | #43 | Exceptional 91.3% |