Immigrants from Liberia vs Icelander Doctorate Degree
COMPARE
Immigrants from Liberia
Icelander
Doctorate Degree
Doctorate Degree Comparison
Immigrants from Liberia
Icelanders
1.5%
DOCTORATE DEGREE
0.5/ 100
METRIC RATING
266th/ 347
METRIC RANK
2.1%
DOCTORATE DEGREE
96.0/ 100
METRIC RATING
118th/ 347
METRIC RANK
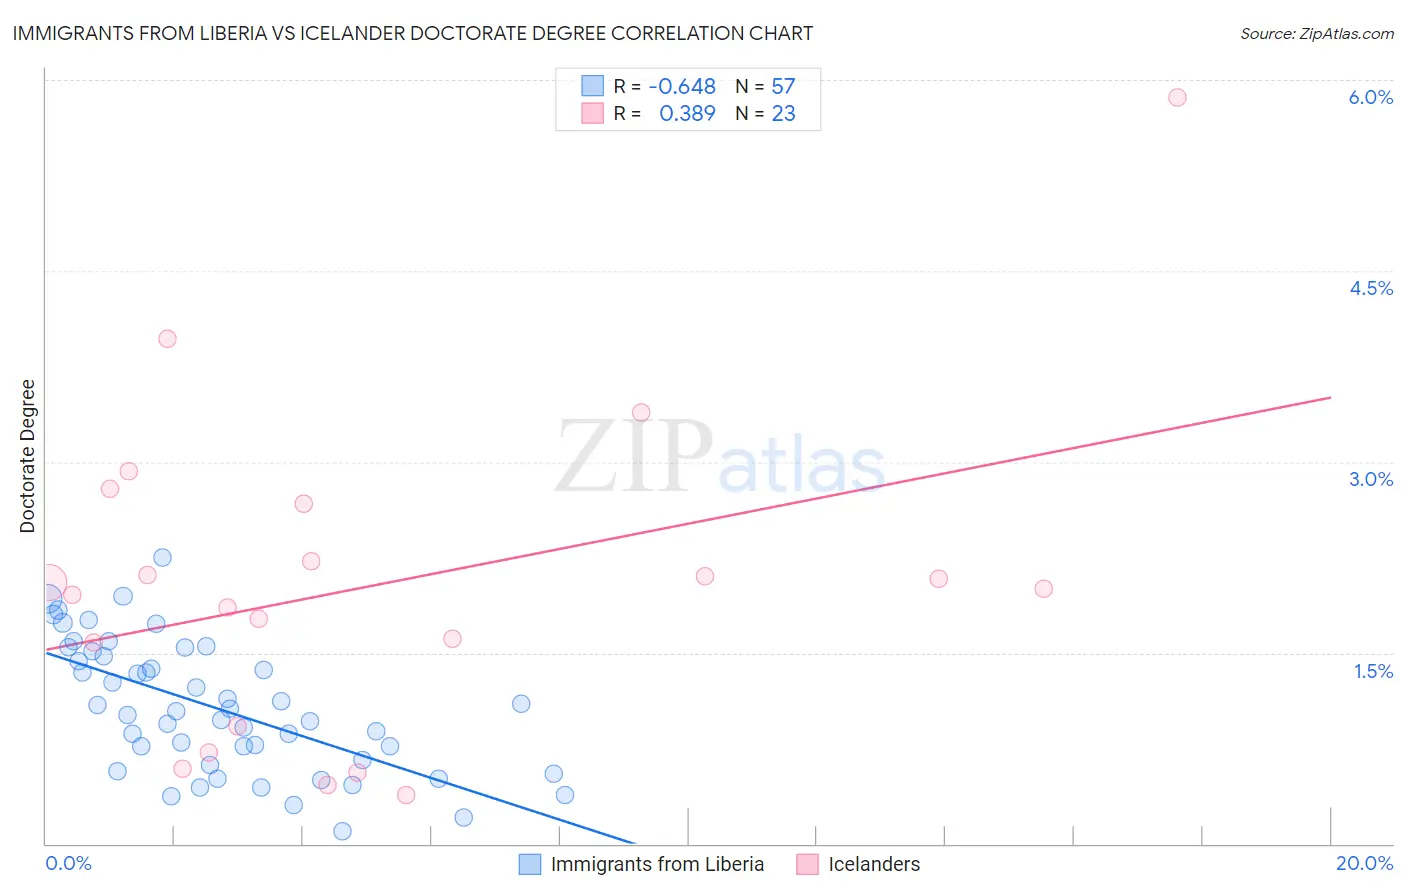
Immigrants from Liberia vs Icelander Doctorate Degree Correlation Chart
The statistical analysis conducted on geographies consisting of 134,868,003 people shows a significant negative correlation between the proportion of Immigrants from Liberia and percentage of population with at least doctorate degree education in the United States with a correlation coefficient (R) of -0.648 and weighted average of 1.5%. Similarly, the statistical analysis conducted on geographies consisting of 159,042,480 people shows a mild positive correlation between the proportion of Icelanders and percentage of population with at least doctorate degree education in the United States with a correlation coefficient (R) of 0.389 and weighted average of 2.1%, a difference of 37.9%.
Doctorate Degree Correlation Summary
| Measurement | Immigrants from Liberia | Icelander |
| Minimum | 0.100% | 0.38% |
| Maximum | 2.2% | 5.9% |
| Range | 2.1% | 5.5% |
| Mean | 1.1% | 2.0% |
| Median | 1.0% | 2.0% |
| Interquartile 25% (IQ1) | 0.64% | 0.93% |
| Interquartile 75% (IQ3) | 1.5% | 2.7% |
| Interquartile Range (IQR) | 0.85% | 1.7% |
| Standard Deviation (Sample) | 0.51% | 1.3% |
| Standard Deviation (Population) | 0.50% | 1.2% |
Similar Demographics by Doctorate Degree
Demographics Similar to Immigrants from Liberia by Doctorate Degree
In terms of doctorate degree, the demographic groups most similar to Immigrants from Liberia are Kiowa (1.5%, a difference of 0.65%), U.S. Virgin Islander (1.5%, a difference of 0.65%), Crow (1.5%, a difference of 0.74%), Salvadoran (1.5%, a difference of 0.77%), and Nicaraguan (1.5%, a difference of 0.78%).
| Demographics | Rating | Rank | Doctorate Degree |
| Liberians | 0.9 /100 | #259 | Tragic 1.5% |
| Japanese | 0.9 /100 | #260 | Tragic 1.5% |
| Immigrants | Portugal | 0.8 /100 | #261 | Tragic 1.5% |
| Chickasaw | 0.7 /100 | #262 | Tragic 1.5% |
| Immigrants | Bahamas | 0.7 /100 | #263 | Tragic 1.5% |
| Blackfeet | 0.7 /100 | #264 | Tragic 1.5% |
| Nicaraguans | 0.6 /100 | #265 | Tragic 1.5% |
| Immigrants | Liberia | 0.5 /100 | #266 | Tragic 1.5% |
| Kiowa | 0.5 /100 | #267 | Tragic 1.5% |
| U.S. Virgin Islanders | 0.5 /100 | #268 | Tragic 1.5% |
| Crow | 0.5 /100 | #269 | Tragic 1.5% |
| Salvadorans | 0.5 /100 | #270 | Tragic 1.5% |
| Immigrants | Trinidad and Tobago | 0.5 /100 | #271 | Tragic 1.5% |
| Immigrants | Barbados | 0.4 /100 | #272 | Tragic 1.5% |
| Sioux | 0.4 /100 | #273 | Tragic 1.5% |
Demographics Similar to Icelanders by Doctorate Degree
In terms of doctorate degree, the demographic groups most similar to Icelanders are Lebanese (2.1%, a difference of 0.040%), Pakistani (2.0%, a difference of 0.13%), Maltese (2.1%, a difference of 0.21%), Immigrants from Morocco (2.0%, a difference of 0.42%), and Taiwanese (2.1%, a difference of 0.67%).
| Demographics | Rating | Rank | Doctorate Degree |
| Immigrants | Pakistan | 97.1 /100 | #111 | Exceptional 2.1% |
| Syrians | 97.1 /100 | #112 | Exceptional 2.1% |
| Immigrants | Italy | 96.9 /100 | #113 | Exceptional 2.1% |
| Immigrants | Croatia | 96.8 /100 | #114 | Exceptional 2.1% |
| Taiwanese | 96.7 /100 | #115 | Exceptional 2.1% |
| Maltese | 96.2 /100 | #116 | Exceptional 2.1% |
| Lebanese | 96.0 /100 | #117 | Exceptional 2.1% |
| Icelanders | 96.0 /100 | #118 | Exceptional 2.1% |
| Pakistanis | 95.8 /100 | #119 | Exceptional 2.0% |
| Immigrants | Morocco | 95.5 /100 | #120 | Exceptional 2.0% |
| Immigrants | Jordan | 94.8 /100 | #121 | Exceptional 2.0% |
| Immigrants | Southern Europe | 94.7 /100 | #122 | Exceptional 2.0% |
| Croatians | 94.0 /100 | #123 | Exceptional 2.0% |
| Ute | 93.2 /100 | #124 | Exceptional 2.0% |
| Moroccans | 93.0 /100 | #125 | Exceptional 2.0% |