Immigrants from Czechoslovakia vs Guyanese 6th Grade
COMPARE
Immigrants from Czechoslovakia
Guyanese
6th Grade
6th Grade Comparison
Immigrants from Czechoslovakia
Guyanese
97.4%
6TH GRADE
97.3/ 100
METRIC RATING
109th/ 347
METRIC RANK
95.6%
6TH GRADE
0.0/ 100
METRIC RATING
307th/ 347
METRIC RANK
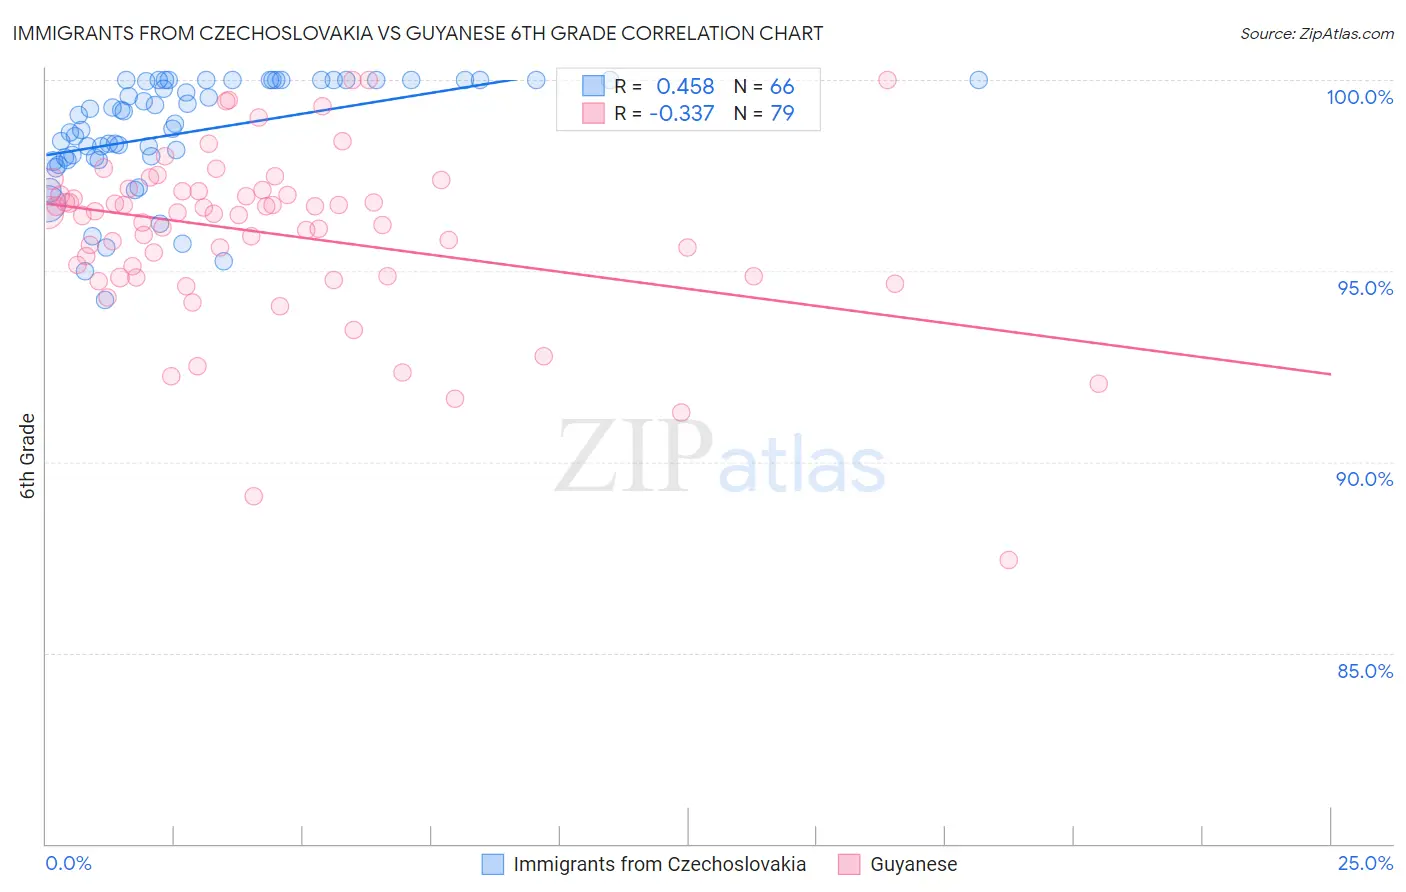
Immigrants from Czechoslovakia vs Guyanese 6th Grade Correlation Chart
The statistical analysis conducted on geographies consisting of 195,448,060 people shows a moderate positive correlation between the proportion of Immigrants from Czechoslovakia and percentage of population with at least 6th grade education in the United States with a correlation coefficient (R) of 0.458 and weighted average of 97.4%. Similarly, the statistical analysis conducted on geographies consisting of 176,921,765 people shows a mild negative correlation between the proportion of Guyanese and percentage of population with at least 6th grade education in the United States with a correlation coefficient (R) of -0.337 and weighted average of 95.6%, a difference of 2.0%.
6th Grade Correlation Summary
| Measurement | Immigrants from Czechoslovakia | Guyanese |
| Minimum | 94.3% | 87.4% |
| Maximum | 100.0% | 100.0% |
| Range | 5.7% | 12.6% |
| Mean | 98.6% | 96.0% |
| Median | 99.0% | 96.5% |
| Interquartile 25% (IQ1) | 98.0% | 94.9% |
| Interquartile 75% (IQ3) | 100.0% | 97.1% |
| Interquartile Range (IQR) | 2.0% | 2.2% |
| Standard Deviation (Sample) | 1.5% | 2.3% |
| Standard Deviation (Population) | 1.4% | 2.2% |
Similar Demographics by 6th Grade
Demographics Similar to Immigrants from Czechoslovakia by 6th Grade
In terms of 6th grade, the demographic groups most similar to Immigrants from Czechoslovakia are Nonimmigrants (97.4%, a difference of 0.0%), Immigrants from Singapore (97.5%, a difference of 0.010%), Menominee (97.5%, a difference of 0.020%), Thai (97.4%, a difference of 0.020%), and Iroquois (97.4%, a difference of 0.020%).
| Demographics | Rating | Rank | 6th Grade |
| Choctaw | 98.0 /100 | #102 | Exceptional 97.5% |
| Bhutanese | 98.0 /100 | #103 | Exceptional 97.5% |
| German Russians | 97.9 /100 | #104 | Exceptional 97.5% |
| Cheyenne | 97.9 /100 | #105 | Exceptional 97.5% |
| Menominee | 97.7 /100 | #106 | Exceptional 97.5% |
| Immigrants | Singapore | 97.6 /100 | #107 | Exceptional 97.5% |
| Immigrants | Nonimmigrants | 97.3 /100 | #108 | Exceptional 97.4% |
| Immigrants | Czechoslovakia | 97.3 /100 | #109 | Exceptional 97.4% |
| Thais | 96.9 /100 | #110 | Exceptional 97.4% |
| Iroquois | 96.9 /100 | #111 | Exceptional 97.4% |
| Immigrants | Latvia | 96.7 /100 | #112 | Exceptional 97.4% |
| Immigrants | Saudi Arabia | 96.5 /100 | #113 | Exceptional 97.4% |
| Colville | 96.4 /100 | #114 | Exceptional 97.4% |
| Immigrants | Switzerland | 95.7 /100 | #115 | Exceptional 97.4% |
| Lebanese | 95.5 /100 | #116 | Exceptional 97.4% |
Demographics Similar to Guyanese by 6th Grade
In terms of 6th grade, the demographic groups most similar to Guyanese are Immigrants from Caribbean (95.6%, a difference of 0.010%), Immigrants from Haiti (95.6%, a difference of 0.020%), Immigrants from Cuba (95.6%, a difference of 0.060%), Puerto Rican (95.5%, a difference of 0.060%), and Ecuadorian (95.5%, a difference of 0.070%).
| Demographics | Rating | Rank | 6th Grade |
| Immigrants | Dominica | 0.0 /100 | #300 | Tragic 95.7% |
| Immigrants | Immigrants | 0.0 /100 | #301 | Tragic 95.7% |
| Immigrants | Burma/Myanmar | 0.0 /100 | #302 | Tragic 95.7% |
| Bangladeshis | 0.0 /100 | #303 | Tragic 95.7% |
| Indonesians | 0.0 /100 | #304 | Tragic 95.6% |
| Immigrants | Cuba | 0.0 /100 | #305 | Tragic 95.6% |
| Immigrants | Haiti | 0.0 /100 | #306 | Tragic 95.6% |
| Guyanese | 0.0 /100 | #307 | Tragic 95.6% |
| Immigrants | Caribbean | 0.0 /100 | #308 | Tragic 95.6% |
| Puerto Ricans | 0.0 /100 | #309 | Tragic 95.5% |
| Ecuadorians | 0.0 /100 | #310 | Tragic 95.5% |
| Immigrants | Portugal | 0.0 /100 | #311 | Tragic 95.5% |
| Immigrants | Guyana | 0.0 /100 | #312 | Tragic 95.5% |
| Nicaraguans | 0.0 /100 | #313 | Tragic 95.4% |
| Immigrants | Vietnam | 0.0 /100 | #314 | Tragic 95.4% |