Tongan vs Immigrants from Albania Family Households with Children
COMPARE
Tongan
Immigrants from Albania
Family Households with Children
Family Households with Children Comparison
Tongans
Immigrants from Albania
31.2%
FAMILY HOUSEHOLDS WITH CHILDREN
100.0/ 100
METRIC RATING
5th/ 347
METRIC RANK
25.9%
FAMILY HOUSEHOLDS WITH CHILDREN
0.0/ 100
METRIC RATING
328th/ 347
METRIC RANK
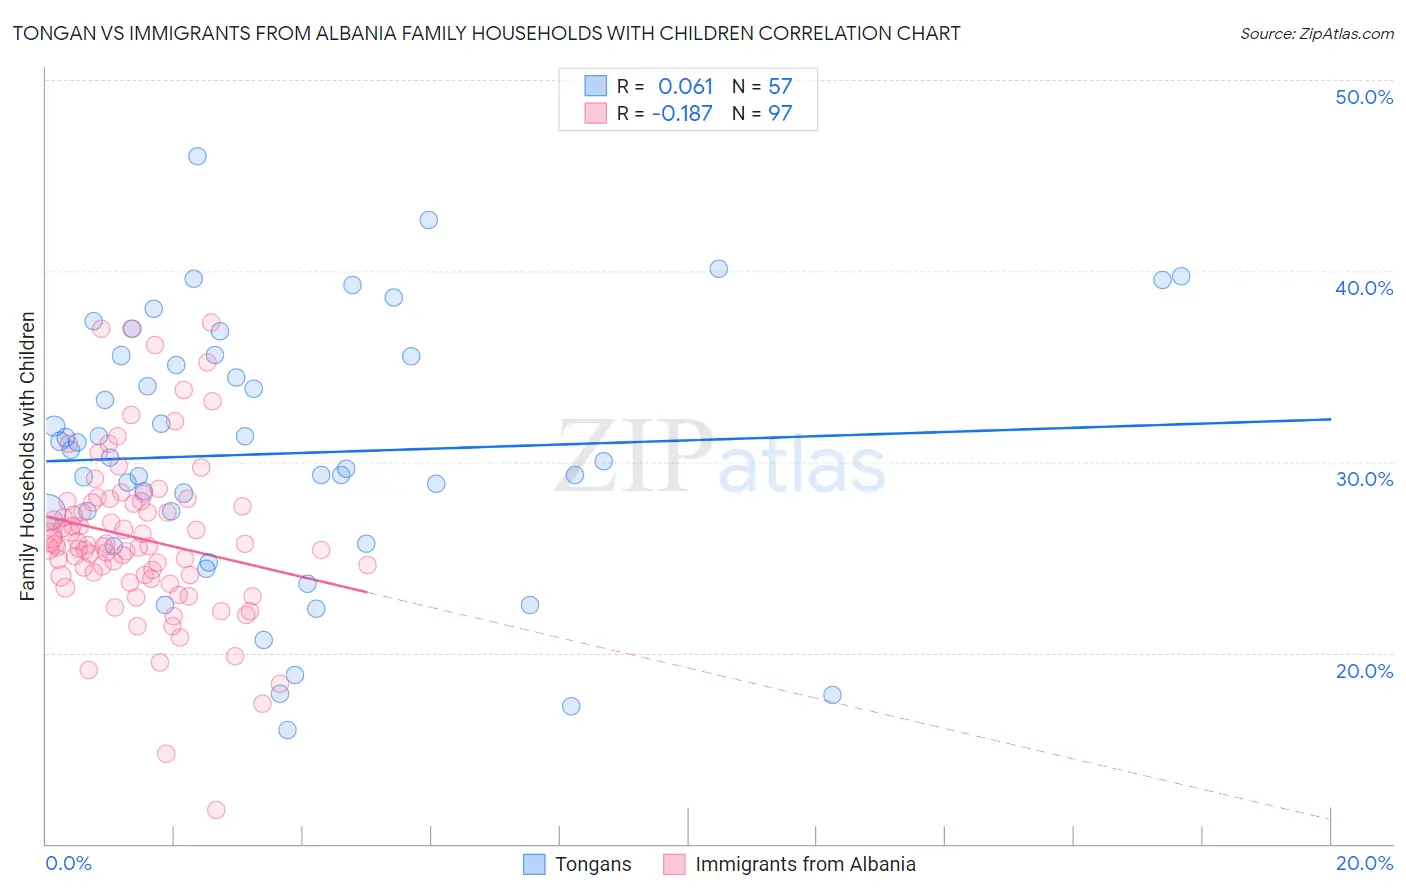
Tongan vs Immigrants from Albania Family Households with Children Correlation Chart
The statistical analysis conducted on geographies consisting of 102,857,266 people shows a slight positive correlation between the proportion of Tongans and percentage of family households with children in the United States with a correlation coefficient (R) of 0.061 and weighted average of 31.2%. Similarly, the statistical analysis conducted on geographies consisting of 119,367,194 people shows a poor negative correlation between the proportion of Immigrants from Albania and percentage of family households with children in the United States with a correlation coefficient (R) of -0.187 and weighted average of 25.9%, a difference of 20.5%.
Family Households with Children Correlation Summary
| Measurement | Tongan | Immigrants from Albania |
| Minimum | 15.9% | 11.8% |
| Maximum | 46.0% | 37.3% |
| Range | 30.1% | 25.5% |
| Mean | 30.4% | 26.0% |
| Median | 30.2% | 25.6% |
| Interquartile 25% (IQ1) | 26.6% | 24.0% |
| Interquartile 75% (IQ3) | 35.5% | 27.9% |
| Interquartile Range (IQR) | 9.0% | 3.9% |
| Standard Deviation (Sample) | 6.8% | 4.3% |
| Standard Deviation (Population) | 6.7% | 4.3% |
Similar Demographics by Family Households with Children
Demographics Similar to Tongans by Family Households with Children
In terms of family households with children, the demographic groups most similar to Tongans are Mexican (31.4%, a difference of 0.41%), Immigrants from India (31.0%, a difference of 0.62%), Immigrants from Central America (31.0%, a difference of 0.91%), Immigrants from Mexico (31.6%, a difference of 1.2%), and Yakama (30.8%, a difference of 1.5%).
| Demographics | Rating | Rank | Family Households with Children |
| Yup'ik | 100 /100 | #1 | Exceptional 37.0% |
| Inupiat | 100 /100 | #2 | Exceptional 32.8% |
| Immigrants | Mexico | 100.0 /100 | #3 | Exceptional 31.6% |
| Mexicans | 100.0 /100 | #4 | Exceptional 31.4% |
| Tongans | 100.0 /100 | #5 | Exceptional 31.2% |
| Immigrants | India | 100.0 /100 | #6 | Exceptional 31.0% |
| Immigrants | Central America | 100.0 /100 | #7 | Exceptional 31.0% |
| Yakama | 100.0 /100 | #8 | Exceptional 30.8% |
| Thais | 100.0 /100 | #9 | Exceptional 30.6% |
| Immigrants | Fiji | 100.0 /100 | #10 | Exceptional 30.5% |
| Nepalese | 100.0 /100 | #11 | Exceptional 30.5% |
| Immigrants | Pakistan | 100.0 /100 | #12 | Exceptional 30.2% |
| Afghans | 100.0 /100 | #13 | Exceptional 30.2% |
| Bangladeshis | 100.0 /100 | #14 | Exceptional 30.1% |
| Immigrants | South Central Asia | 100.0 /100 | #15 | Exceptional 30.0% |
Demographics Similar to Immigrants from Albania by Family Households with Children
In terms of family households with children, the demographic groups most similar to Immigrants from Albania are Immigrants from Barbados (26.0%, a difference of 0.10%), Cypriot (25.9%, a difference of 0.13%), Immigrants from Ireland (26.0%, a difference of 0.21%), Barbadian (26.0%, a difference of 0.24%), and Chinese (26.0%, a difference of 0.29%).
| Demographics | Rating | Rank | Family Households with Children |
| British West Indians | 0.0 /100 | #321 | Tragic 26.0% |
| Immigrants | Greece | 0.0 /100 | #322 | Tragic 26.0% |
| Immigrants | Australia | 0.0 /100 | #323 | Tragic 26.0% |
| Chinese | 0.0 /100 | #324 | Tragic 26.0% |
| Barbadians | 0.0 /100 | #325 | Tragic 26.0% |
| Immigrants | Ireland | 0.0 /100 | #326 | Tragic 26.0% |
| Immigrants | Barbados | 0.0 /100 | #327 | Tragic 26.0% |
| Immigrants | Albania | 0.0 /100 | #328 | Tragic 25.9% |
| Cypriots | 0.0 /100 | #329 | Tragic 25.9% |
| Immigrants | Latvia | 0.0 /100 | #330 | Tragic 25.9% |
| Slovenes | 0.0 /100 | #331 | Tragic 25.8% |
| Immigrants | Austria | 0.0 /100 | #332 | Tragic 25.8% |
| Immigrants | Switzerland | 0.0 /100 | #333 | Tragic 25.7% |
| Slovaks | 0.0 /100 | #334 | Tragic 25.7% |
| Immigrants | Croatia | 0.0 /100 | #335 | Tragic 25.7% |