Tohono O'odham vs Pueblo 10th Grade
COMPARE
Tohono O'odham
Pueblo
10th Grade
10th Grade Comparison
Tohono O'odham
Pueblo
90.1%
10TH GRADE
0.0/ 100
METRIC RATING
322nd/ 347
METRIC RANK
93.5%
10TH GRADE
23.9/ 100
METRIC RATING
197th/ 347
METRIC RANK
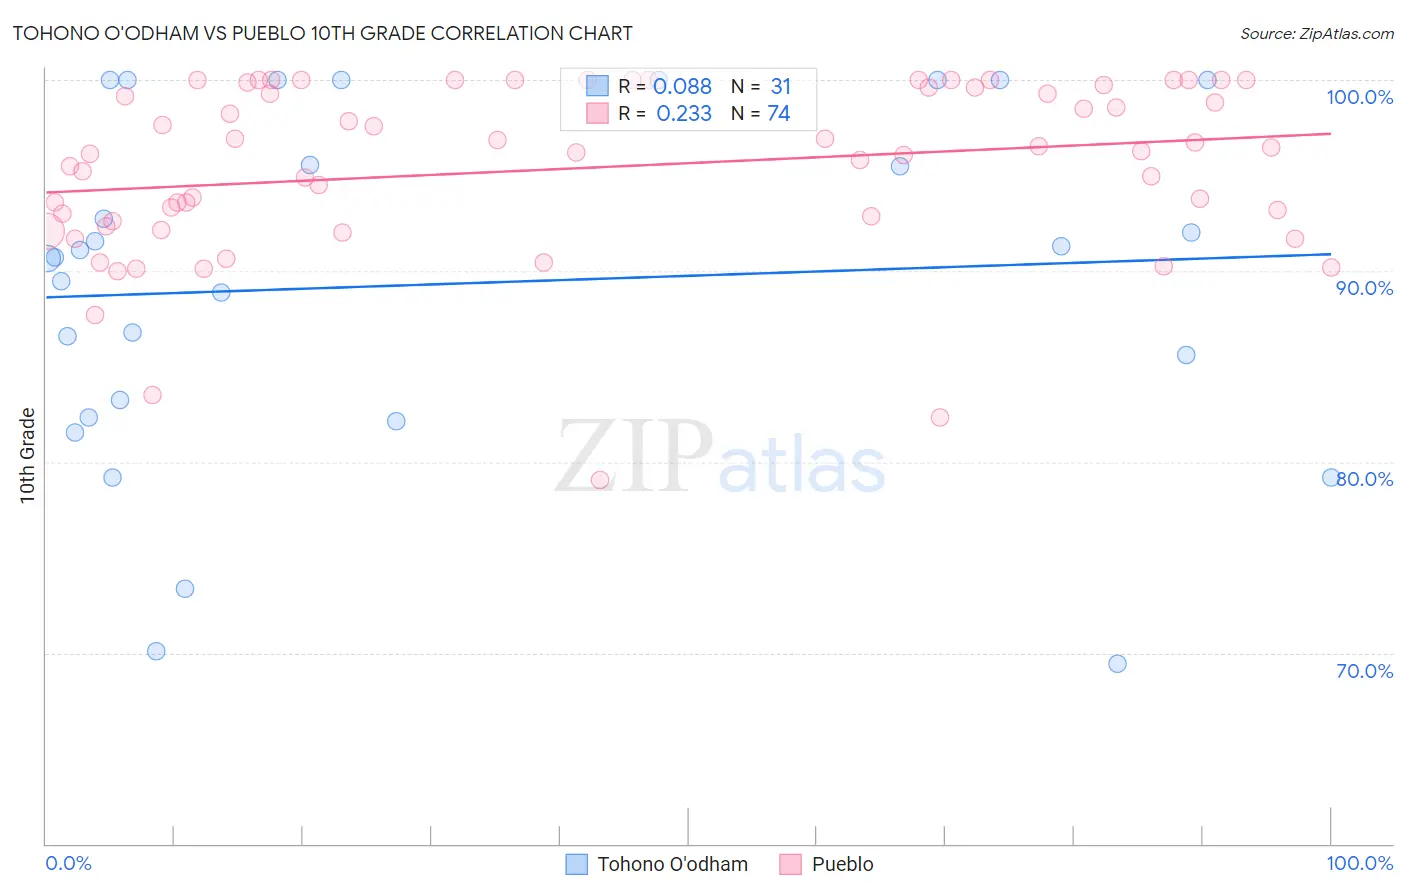
Tohono O'odham vs Pueblo 10th Grade Correlation Chart
The statistical analysis conducted on geographies consisting of 58,730,615 people shows a slight positive correlation between the proportion of Tohono O'odham and percentage of population with at least 10th grade education in the United States with a correlation coefficient (R) of 0.088 and weighted average of 90.1%. Similarly, the statistical analysis conducted on geographies consisting of 120,087,458 people shows a weak positive correlation between the proportion of Pueblo and percentage of population with at least 10th grade education in the United States with a correlation coefficient (R) of 0.233 and weighted average of 93.5%, a difference of 3.7%.
10th Grade Correlation Summary
| Measurement | Tohono O'odham | Pueblo |
| Minimum | 69.4% | 79.1% |
| Maximum | 100.0% | 100.0% |
| Range | 30.6% | 20.9% |
| Mean | 89.3% | 95.4% |
| Median | 90.7% | 96.2% |
| Interquartile 25% (IQ1) | 82.3% | 92.6% |
| Interquartile 75% (IQ3) | 100.0% | 99.6% |
| Interquartile Range (IQR) | 17.7% | 7.0% |
| Standard Deviation (Sample) | 9.1% | 4.5% |
| Standard Deviation (Population) | 8.9% | 4.5% |
Similar Demographics by 10th Grade
Demographics Similar to Tohono O'odham by 10th Grade
In terms of 10th grade, the demographic groups most similar to Tohono O'odham are Houma (90.2%, a difference of 0.010%), Belizean (90.2%, a difference of 0.010%), Nicaraguan (90.2%, a difference of 0.020%), Immigrants from Belize (90.1%, a difference of 0.090%), and Immigrants from Cuba (90.2%, a difference of 0.10%).
| Demographics | Rating | Rank | 10th Grade |
| Immigrants | Caribbean | 0.0 /100 | #315 | Tragic 90.6% |
| Ecuadorians | 0.0 /100 | #316 | Tragic 90.6% |
| Immigrants | Ecuador | 0.0 /100 | #317 | Tragic 90.4% |
| Immigrants | Cuba | 0.0 /100 | #318 | Tragic 90.2% |
| Nicaraguans | 0.0 /100 | #319 | Tragic 90.2% |
| Houma | 0.0 /100 | #320 | Tragic 90.2% |
| Belizeans | 0.0 /100 | #321 | Tragic 90.2% |
| Tohono O'odham | 0.0 /100 | #322 | Tragic 90.1% |
| Immigrants | Belize | 0.0 /100 | #323 | Tragic 90.1% |
| Immigrants | Armenia | 0.0 /100 | #324 | Tragic 89.9% |
| Puerto Ricans | 0.0 /100 | #325 | Tragic 89.8% |
| Central American Indians | 0.0 /100 | #326 | Tragic 89.7% |
| Immigrants | Nicaragua | 0.0 /100 | #327 | Tragic 89.5% |
| Immigrants | Cabo Verde | 0.0 /100 | #328 | Tragic 89.5% |
| Dominicans | 0.0 /100 | #329 | Tragic 89.4% |
Demographics Similar to Pueblo by 10th Grade
In terms of 10th grade, the demographic groups most similar to Pueblo are Immigrants from Micronesia (93.5%, a difference of 0.010%), Asian (93.5%, a difference of 0.010%), Moroccan (93.5%, a difference of 0.020%), Hopi (93.5%, a difference of 0.020%), and Cheyenne (93.5%, a difference of 0.030%).
| Demographics | Rating | Rank | 10th Grade |
| Laotians | 32.1 /100 | #190 | Fair 93.6% |
| Yup'ik | 31.1 /100 | #191 | Fair 93.6% |
| Immigrants | Malaysia | 28.0 /100 | #192 | Fair 93.5% |
| Panamanians | 28.0 /100 | #193 | Fair 93.5% |
| Immigrants | Morocco | 26.9 /100 | #194 | Fair 93.5% |
| Cheyenne | 26.8 /100 | #195 | Fair 93.5% |
| Moroccans | 25.3 /100 | #196 | Fair 93.5% |
| Pueblo | 23.9 /100 | #197 | Fair 93.5% |
| Immigrants | Micronesia | 23.2 /100 | #198 | Fair 93.5% |
| Asians | 23.0 /100 | #199 | Fair 93.5% |
| Hopi | 22.2 /100 | #200 | Fair 93.5% |
| Hawaiians | 21.8 /100 | #201 | Fair 93.5% |
| Immigrants | Uganda | 20.9 /100 | #202 | Fair 93.5% |
| Immigrants | Western Asia | 20.6 /100 | #203 | Fair 93.4% |
| Ute | 20.3 /100 | #204 | Fair 93.4% |