Immigrants from Cuba vs Pueblo 10th Grade
COMPARE
Immigrants from Cuba
Pueblo
10th Grade
10th Grade Comparison
Immigrants from Cuba
Pueblo
90.2%
10TH GRADE
0.0/ 100
METRIC RATING
318th/ 347
METRIC RANK
93.5%
10TH GRADE
23.9/ 100
METRIC RATING
197th/ 347
METRIC RANK
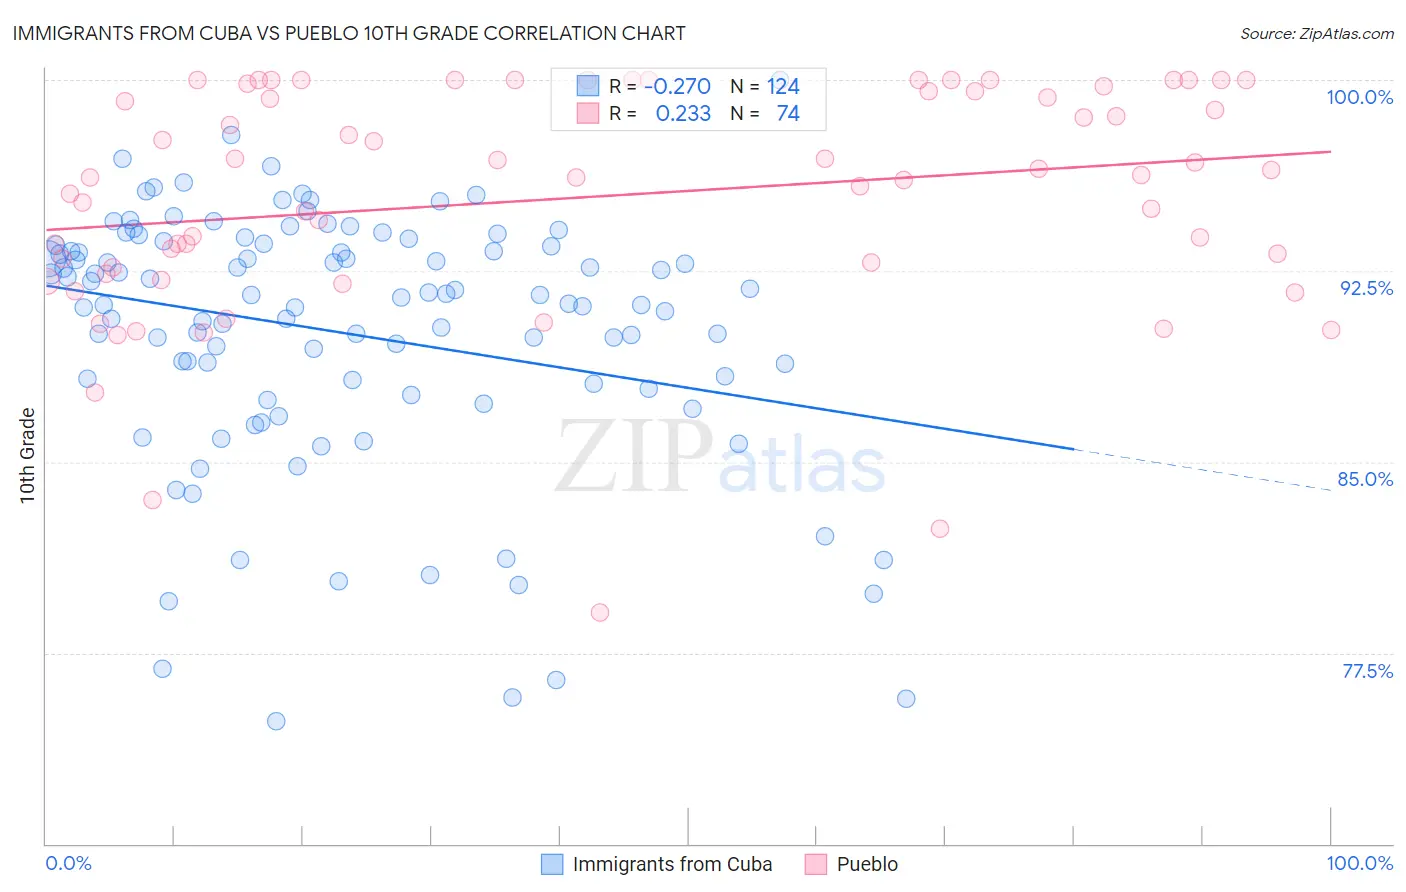
Immigrants from Cuba vs Pueblo 10th Grade Correlation Chart
The statistical analysis conducted on geographies consisting of 326,019,170 people shows a weak negative correlation between the proportion of Immigrants from Cuba and percentage of population with at least 10th grade education in the United States with a correlation coefficient (R) of -0.270 and weighted average of 90.2%. Similarly, the statistical analysis conducted on geographies consisting of 120,087,458 people shows a weak positive correlation between the proportion of Pueblo and percentage of population with at least 10th grade education in the United States with a correlation coefficient (R) of 0.233 and weighted average of 93.5%, a difference of 3.6%.
10th Grade Correlation Summary
| Measurement | Immigrants from Cuba | Pueblo |
| Minimum | 74.8% | 79.1% |
| Maximum | 100.0% | 100.0% |
| Range | 25.2% | 20.9% |
| Mean | 90.1% | 95.4% |
| Median | 91.3% | 96.2% |
| Interquartile 25% (IQ1) | 88.0% | 92.6% |
| Interquartile 75% (IQ3) | 93.5% | 99.6% |
| Interquartile Range (IQR) | 5.5% | 7.0% |
| Standard Deviation (Sample) | 5.0% | 4.5% |
| Standard Deviation (Population) | 5.0% | 4.5% |
Similar Demographics by 10th Grade
Demographics Similar to Immigrants from Cuba by 10th Grade
In terms of 10th grade, the demographic groups most similar to Immigrants from Cuba are Nicaraguan (90.2%, a difference of 0.080%), Houma (90.2%, a difference of 0.090%), Belizean (90.2%, a difference of 0.090%), Tohono O'odham (90.1%, a difference of 0.10%), and Immigrants from Belize (90.1%, a difference of 0.19%).
| Demographics | Rating | Rank | 10th Grade |
| Immigrants | Cambodia | 0.0 /100 | #311 | Tragic 90.9% |
| Immigrants | Portugal | 0.0 /100 | #312 | Tragic 90.8% |
| Cape Verdeans | 0.0 /100 | #313 | Tragic 90.8% |
| Nepalese | 0.0 /100 | #314 | Tragic 90.7% |
| Immigrants | Caribbean | 0.0 /100 | #315 | Tragic 90.6% |
| Ecuadorians | 0.0 /100 | #316 | Tragic 90.6% |
| Immigrants | Ecuador | 0.0 /100 | #317 | Tragic 90.4% |
| Immigrants | Cuba | 0.0 /100 | #318 | Tragic 90.2% |
| Nicaraguans | 0.0 /100 | #319 | Tragic 90.2% |
| Houma | 0.0 /100 | #320 | Tragic 90.2% |
| Belizeans | 0.0 /100 | #321 | Tragic 90.2% |
| Tohono O'odham | 0.0 /100 | #322 | Tragic 90.1% |
| Immigrants | Belize | 0.0 /100 | #323 | Tragic 90.1% |
| Immigrants | Armenia | 0.0 /100 | #324 | Tragic 89.9% |
| Puerto Ricans | 0.0 /100 | #325 | Tragic 89.8% |
Demographics Similar to Pueblo by 10th Grade
In terms of 10th grade, the demographic groups most similar to Pueblo are Immigrants from Micronesia (93.5%, a difference of 0.010%), Asian (93.5%, a difference of 0.010%), Moroccan (93.5%, a difference of 0.020%), Hopi (93.5%, a difference of 0.020%), and Cheyenne (93.5%, a difference of 0.030%).
| Demographics | Rating | Rank | 10th Grade |
| Laotians | 32.1 /100 | #190 | Fair 93.6% |
| Yup'ik | 31.1 /100 | #191 | Fair 93.6% |
| Immigrants | Malaysia | 28.0 /100 | #192 | Fair 93.5% |
| Panamanians | 28.0 /100 | #193 | Fair 93.5% |
| Immigrants | Morocco | 26.9 /100 | #194 | Fair 93.5% |
| Cheyenne | 26.8 /100 | #195 | Fair 93.5% |
| Moroccans | 25.3 /100 | #196 | Fair 93.5% |
| Pueblo | 23.9 /100 | #197 | Fair 93.5% |
| Immigrants | Micronesia | 23.2 /100 | #198 | Fair 93.5% |
| Asians | 23.0 /100 | #199 | Fair 93.5% |
| Hopi | 22.2 /100 | #200 | Fair 93.5% |
| Hawaiians | 21.8 /100 | #201 | Fair 93.5% |
| Immigrants | Uganda | 20.9 /100 | #202 | Fair 93.5% |
| Immigrants | Western Asia | 20.6 /100 | #203 | Fair 93.4% |
| Ute | 20.3 /100 | #204 | Fair 93.4% |