Tohono O'odham vs Pima 10th Grade
COMPARE
Tohono O'odham
Pima
10th Grade
10th Grade Comparison
Tohono O'odham
Pima
90.1%
10TH GRADE
0.0/ 100
METRIC RATING
322nd/ 347
METRIC RANK
91.2%
10TH GRADE
0.0/ 100
METRIC RATING
304th/ 347
METRIC RANK
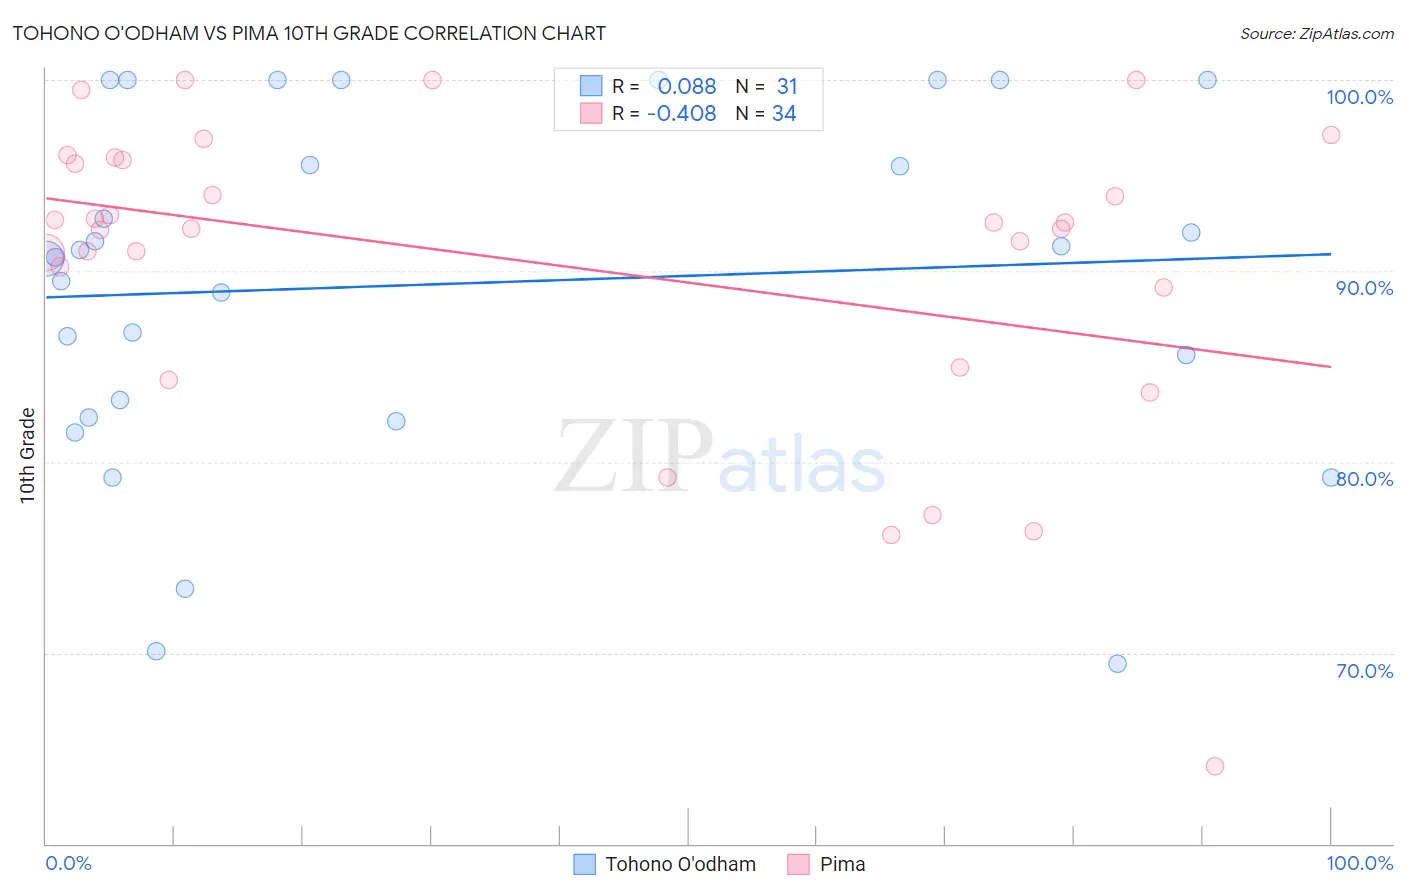
Tohono O'odham vs Pima 10th Grade Correlation Chart
The statistical analysis conducted on geographies consisting of 58,730,615 people shows a slight positive correlation between the proportion of Tohono O'odham and percentage of population with at least 10th grade education in the United States with a correlation coefficient (R) of 0.088 and weighted average of 90.1%. Similarly, the statistical analysis conducted on geographies consisting of 61,552,942 people shows a moderate negative correlation between the proportion of Pima and percentage of population with at least 10th grade education in the United States with a correlation coefficient (R) of -0.408 and weighted average of 91.2%, a difference of 1.1%.
10th Grade Correlation Summary
| Measurement | Tohono O'odham | Pima |
| Minimum | 69.4% | 64.0% |
| Maximum | 100.0% | 100.0% |
| Range | 30.6% | 36.0% |
| Mean | 89.3% | 90.4% |
| Median | 90.7% | 92.4% |
| Interquartile 25% (IQ1) | 82.3% | 89.1% |
| Interquartile 75% (IQ3) | 100.0% | 95.8% |
| Interquartile Range (IQR) | 17.7% | 6.7% |
| Standard Deviation (Sample) | 9.1% | 8.0% |
| Standard Deviation (Population) | 8.9% | 7.9% |
Demographics Similar to Tohono O'odham and Pima by 10th Grade
In terms of 10th grade, the demographic groups most similar to Tohono O'odham are Houma (90.2%, a difference of 0.010%), Belizean (90.2%, a difference of 0.010%), Nicaraguan (90.2%, a difference of 0.020%), Immigrants from Belize (90.1%, a difference of 0.090%), and Immigrants from Cuba (90.2%, a difference of 0.10%). Similarly, the demographic groups most similar to Pima are Immigrants from Dominica (91.1%, a difference of 0.020%), Immigrants from Vietnam (91.2%, a difference of 0.060%), Yaqui (91.1%, a difference of 0.080%), Immigrants from Fiji (91.0%, a difference of 0.14%), and Immigrants from Bangladesh (91.0%, a difference of 0.14%).
| Demographics | Rating | Rank | 10th Grade |
| Immigrants | Vietnam | 0.0 /100 | #303 | Tragic 91.2% |
| Pima | 0.0 /100 | #304 | Tragic 91.2% |
| Immigrants | Dominica | 0.0 /100 | #305 | Tragic 91.1% |
| Yaqui | 0.0 /100 | #306 | Tragic 91.1% |
| Immigrants | Fiji | 0.0 /100 | #307 | Tragic 91.0% |
| Immigrants | Bangladesh | 0.0 /100 | #308 | Tragic 91.0% |
| Immigrants | Immigrants | 0.0 /100 | #309 | Tragic 91.0% |
| Vietnamese | 0.0 /100 | #310 | Tragic 90.9% |
| Immigrants | Cambodia | 0.0 /100 | #311 | Tragic 90.9% |
| Immigrants | Portugal | 0.0 /100 | #312 | Tragic 90.8% |
| Cape Verdeans | 0.0 /100 | #313 | Tragic 90.8% |
| Nepalese | 0.0 /100 | #314 | Tragic 90.7% |
| Immigrants | Caribbean | 0.0 /100 | #315 | Tragic 90.6% |
| Ecuadorians | 0.0 /100 | #316 | Tragic 90.6% |
| Immigrants | Ecuador | 0.0 /100 | #317 | Tragic 90.4% |
| Immigrants | Cuba | 0.0 /100 | #318 | Tragic 90.2% |
| Nicaraguans | 0.0 /100 | #319 | Tragic 90.2% |
| Houma | 0.0 /100 | #320 | Tragic 90.2% |
| Belizeans | 0.0 /100 | #321 | Tragic 90.2% |
| Tohono O'odham | 0.0 /100 | #322 | Tragic 90.1% |
| Immigrants | Belize | 0.0 /100 | #323 | Tragic 90.1% |