Tohono O'odham vs Immigrants from Sweden 10th Grade
COMPARE
Tohono O'odham
Immigrants from Sweden
10th Grade
10th Grade Comparison
Tohono O'odham
Immigrants from Sweden
90.1%
10TH GRADE
0.0/ 100
METRIC RATING
322nd/ 347
METRIC RANK
94.9%
10TH GRADE
99.6/ 100
METRIC RATING
72nd/ 347
METRIC RANK
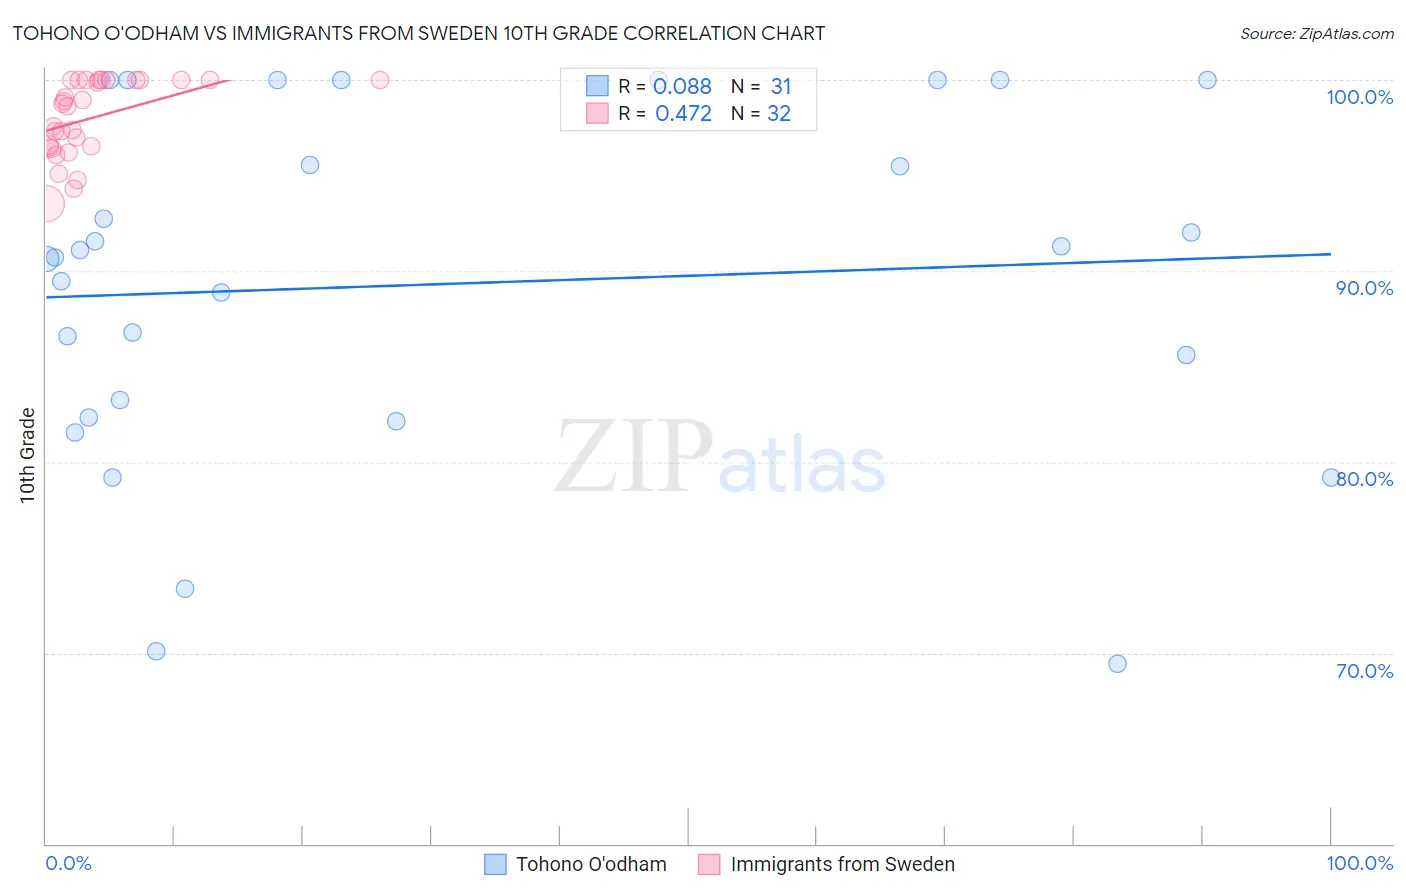
Tohono O'odham vs Immigrants from Sweden 10th Grade Correlation Chart
The statistical analysis conducted on geographies consisting of 58,730,615 people shows a slight positive correlation between the proportion of Tohono O'odham and percentage of population with at least 10th grade education in the United States with a correlation coefficient (R) of 0.088 and weighted average of 90.1%. Similarly, the statistical analysis conducted on geographies consisting of 164,736,894 people shows a moderate positive correlation between the proportion of Immigrants from Sweden and percentage of population with at least 10th grade education in the United States with a correlation coefficient (R) of 0.472 and weighted average of 94.9%, a difference of 5.2%.
10th Grade Correlation Summary
| Measurement | Tohono O'odham | Immigrants from Sweden |
| Minimum | 69.4% | 93.5% |
| Maximum | 100.0% | 100.0% |
| Range | 30.6% | 6.5% |
| Mean | 89.3% | 98.0% |
| Median | 90.7% | 98.7% |
| Interquartile 25% (IQ1) | 82.3% | 96.5% |
| Interquartile 75% (IQ3) | 100.0% | 100.0% |
| Interquartile Range (IQR) | 17.7% | 3.5% |
| Standard Deviation (Sample) | 9.1% | 2.0% |
| Standard Deviation (Population) | 8.9% | 2.0% |
Similar Demographics by 10th Grade
Demographics Similar to Tohono O'odham by 10th Grade
In terms of 10th grade, the demographic groups most similar to Tohono O'odham are Houma (90.2%, a difference of 0.010%), Belizean (90.2%, a difference of 0.010%), Nicaraguan (90.2%, a difference of 0.020%), Immigrants from Belize (90.1%, a difference of 0.090%), and Immigrants from Cuba (90.2%, a difference of 0.10%).
| Demographics | Rating | Rank | 10th Grade |
| Immigrants | Caribbean | 0.0 /100 | #315 | Tragic 90.6% |
| Ecuadorians | 0.0 /100 | #316 | Tragic 90.6% |
| Immigrants | Ecuador | 0.0 /100 | #317 | Tragic 90.4% |
| Immigrants | Cuba | 0.0 /100 | #318 | Tragic 90.2% |
| Nicaraguans | 0.0 /100 | #319 | Tragic 90.2% |
| Houma | 0.0 /100 | #320 | Tragic 90.2% |
| Belizeans | 0.0 /100 | #321 | Tragic 90.2% |
| Tohono O'odham | 0.0 /100 | #322 | Tragic 90.1% |
| Immigrants | Belize | 0.0 /100 | #323 | Tragic 90.1% |
| Immigrants | Armenia | 0.0 /100 | #324 | Tragic 89.9% |
| Puerto Ricans | 0.0 /100 | #325 | Tragic 89.8% |
| Central American Indians | 0.0 /100 | #326 | Tragic 89.7% |
| Immigrants | Nicaragua | 0.0 /100 | #327 | Tragic 89.5% |
| Immigrants | Cabo Verde | 0.0 /100 | #328 | Tragic 89.5% |
| Dominicans | 0.0 /100 | #329 | Tragic 89.4% |
Demographics Similar to Immigrants from Sweden by 10th Grade
In terms of 10th grade, the demographic groups most similar to Immigrants from Sweden are Bhutanese (94.9%, a difference of 0.010%), Canadian (94.9%, a difference of 0.010%), Zimbabwean (94.9%, a difference of 0.020%), Alaska Native (94.9%, a difference of 0.020%), and Immigrants from England (94.9%, a difference of 0.030%).
| Demographics | Rating | Rank | 10th Grade |
| Turks | 99.7 /100 | #65 | Exceptional 95.0% |
| Immigrants | Australia | 99.7 /100 | #66 | Exceptional 94.9% |
| Immigrants | Netherlands | 99.7 /100 | #67 | Exceptional 94.9% |
| Immigrants | Belgium | 99.7 /100 | #68 | Exceptional 94.9% |
| Immigrants | England | 99.6 /100 | #69 | Exceptional 94.9% |
| Zimbabweans | 99.6 /100 | #70 | Exceptional 94.9% |
| Alaska Natives | 99.6 /100 | #71 | Exceptional 94.9% |
| Immigrants | Sweden | 99.6 /100 | #72 | Exceptional 94.9% |
| Bhutanese | 99.6 /100 | #73 | Exceptional 94.9% |
| Canadians | 99.6 /100 | #74 | Exceptional 94.9% |
| Okinawans | 99.5 /100 | #75 | Exceptional 94.8% |
| Romanians | 99.5 /100 | #76 | Exceptional 94.8% |
| Immigrants | South Africa | 99.5 /100 | #77 | Exceptional 94.8% |
| Filipinos | 99.3 /100 | #78 | Exceptional 94.8% |
| Immigrants | Czechoslovakia | 99.2 /100 | #79 | Exceptional 94.7% |