Colville vs Pueblo 10th Grade
COMPARE
Colville
Pueblo
10th Grade
10th Grade Comparison
Colville
Pueblo
93.6%
10TH GRADE
38.8/ 100
METRIC RATING
182nd/ 347
METRIC RANK
93.5%
10TH GRADE
23.9/ 100
METRIC RATING
197th/ 347
METRIC RANK
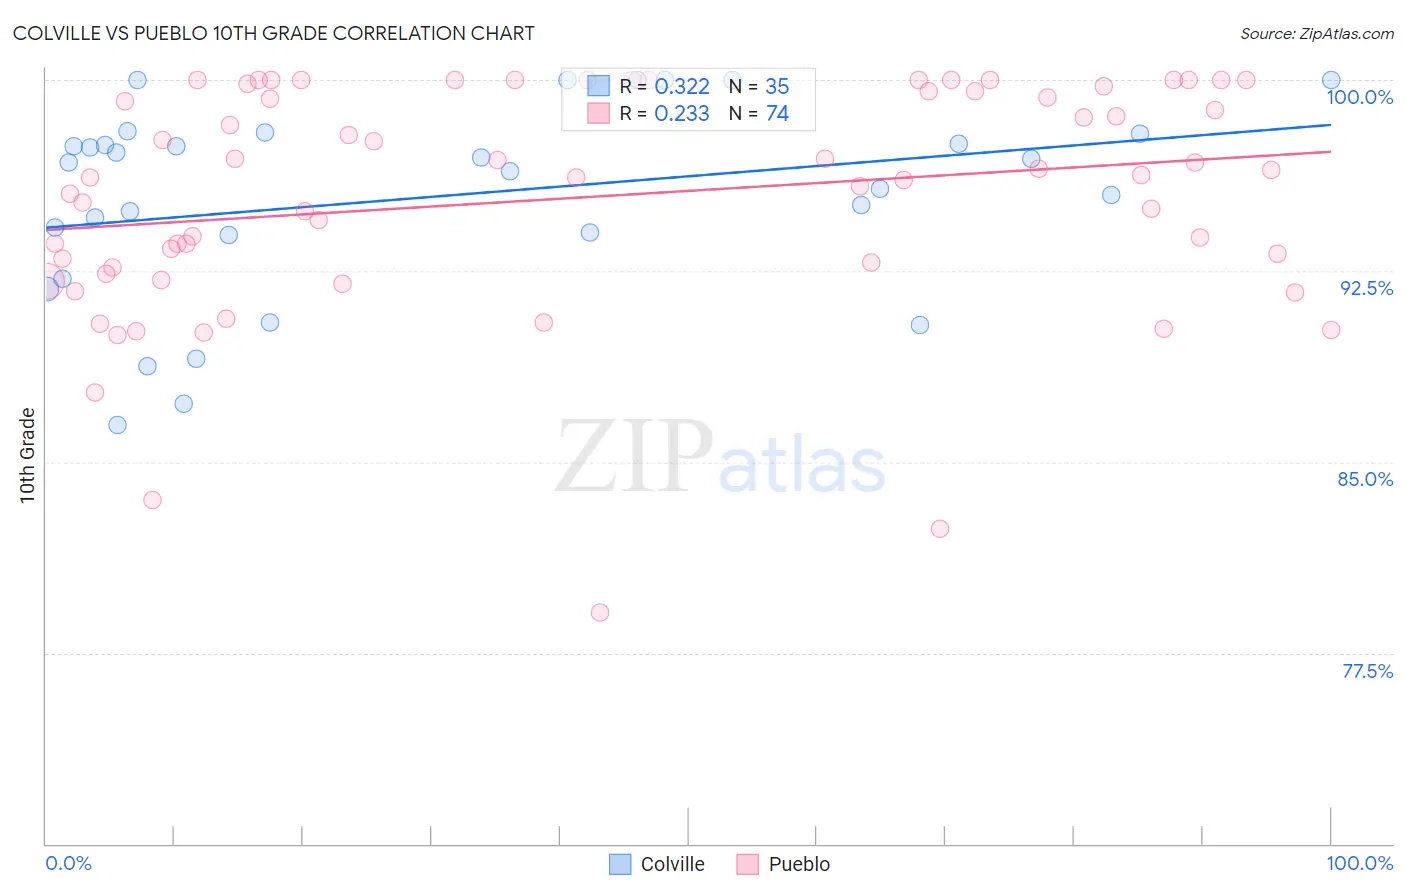
Colville vs Pueblo 10th Grade Correlation Chart
The statistical analysis conducted on geographies consisting of 34,682,094 people shows a mild positive correlation between the proportion of Colville and percentage of population with at least 10th grade education in the United States with a correlation coefficient (R) of 0.322 and weighted average of 93.6%. Similarly, the statistical analysis conducted on geographies consisting of 120,087,458 people shows a weak positive correlation between the proportion of Pueblo and percentage of population with at least 10th grade education in the United States with a correlation coefficient (R) of 0.233 and weighted average of 93.5%, a difference of 0.16%.
10th Grade Correlation Summary
| Measurement | Colville | Pueblo |
| Minimum | 86.4% | 79.1% |
| Maximum | 100.0% | 100.0% |
| Range | 13.6% | 20.9% |
| Mean | 95.4% | 95.4% |
| Median | 96.8% | 96.2% |
| Interquartile 25% (IQ1) | 93.9% | 92.6% |
| Interquartile 75% (IQ3) | 97.9% | 99.6% |
| Interquartile Range (IQR) | 4.0% | 7.0% |
| Standard Deviation (Sample) | 3.8% | 4.5% |
| Standard Deviation (Population) | 3.7% | 4.5% |
Demographics Similar to Colville and Pueblo by 10th Grade
In terms of 10th grade, the demographic groups most similar to Colville are Guamanian/Chamorro (93.6%, a difference of 0.020%), Choctaw (93.6%, a difference of 0.020%), Sudanese (93.6%, a difference of 0.020%), Immigrants from Northern Africa (93.7%, a difference of 0.030%), and Blackfeet (93.7%, a difference of 0.040%). Similarly, the demographic groups most similar to Pueblo are Immigrants from Micronesia (93.5%, a difference of 0.010%), Asian (93.5%, a difference of 0.010%), Moroccan (93.5%, a difference of 0.020%), Cheyenne (93.5%, a difference of 0.030%), and Immigrants from Morocco (93.5%, a difference of 0.040%).
| Demographics | Rating | Rank | 10th Grade |
| Paraguayans | 45.3 /100 | #179 | Average 93.7% |
| Blackfeet | 42.8 /100 | #180 | Average 93.7% |
| Immigrants | Northern Africa | 41.6 /100 | #181 | Average 93.7% |
| Colville | 38.8 /100 | #182 | Fair 93.6% |
| Guamanians/Chamorros | 37.1 /100 | #183 | Fair 93.6% |
| Choctaw | 36.6 /100 | #184 | Fair 93.6% |
| Sudanese | 36.6 /100 | #185 | Fair 93.6% |
| Immigrants | Eastern Asia | 35.1 /100 | #186 | Fair 93.6% |
| Liberians | 34.7 /100 | #187 | Fair 93.6% |
| Marshallese | 33.2 /100 | #188 | Fair 93.6% |
| Immigrants | Pakistan | 32.5 /100 | #189 | Fair 93.6% |
| Laotians | 32.1 /100 | #190 | Fair 93.6% |
| Yup'ik | 31.1 /100 | #191 | Fair 93.6% |
| Immigrants | Malaysia | 28.0 /100 | #192 | Fair 93.5% |
| Panamanians | 28.0 /100 | #193 | Fair 93.5% |
| Immigrants | Morocco | 26.9 /100 | #194 | Fair 93.5% |
| Cheyenne | 26.8 /100 | #195 | Fair 93.5% |
| Moroccans | 25.3 /100 | #196 | Fair 93.5% |
| Pueblo | 23.9 /100 | #197 | Fair 93.5% |
| Immigrants | Micronesia | 23.2 /100 | #198 | Fair 93.5% |
| Asians | 23.0 /100 | #199 | Fair 93.5% |