Tohono O'odham vs Immigrants from Jamaica 10th Grade
COMPARE
Tohono O'odham
Immigrants from Jamaica
10th Grade
10th Grade Comparison
Tohono O'odham
Immigrants from Jamaica
90.1%
10TH GRADE
0.0/ 100
METRIC RATING
322nd/ 347
METRIC RANK
92.6%
10TH GRADE
0.5/ 100
METRIC RATING
259th/ 347
METRIC RANK
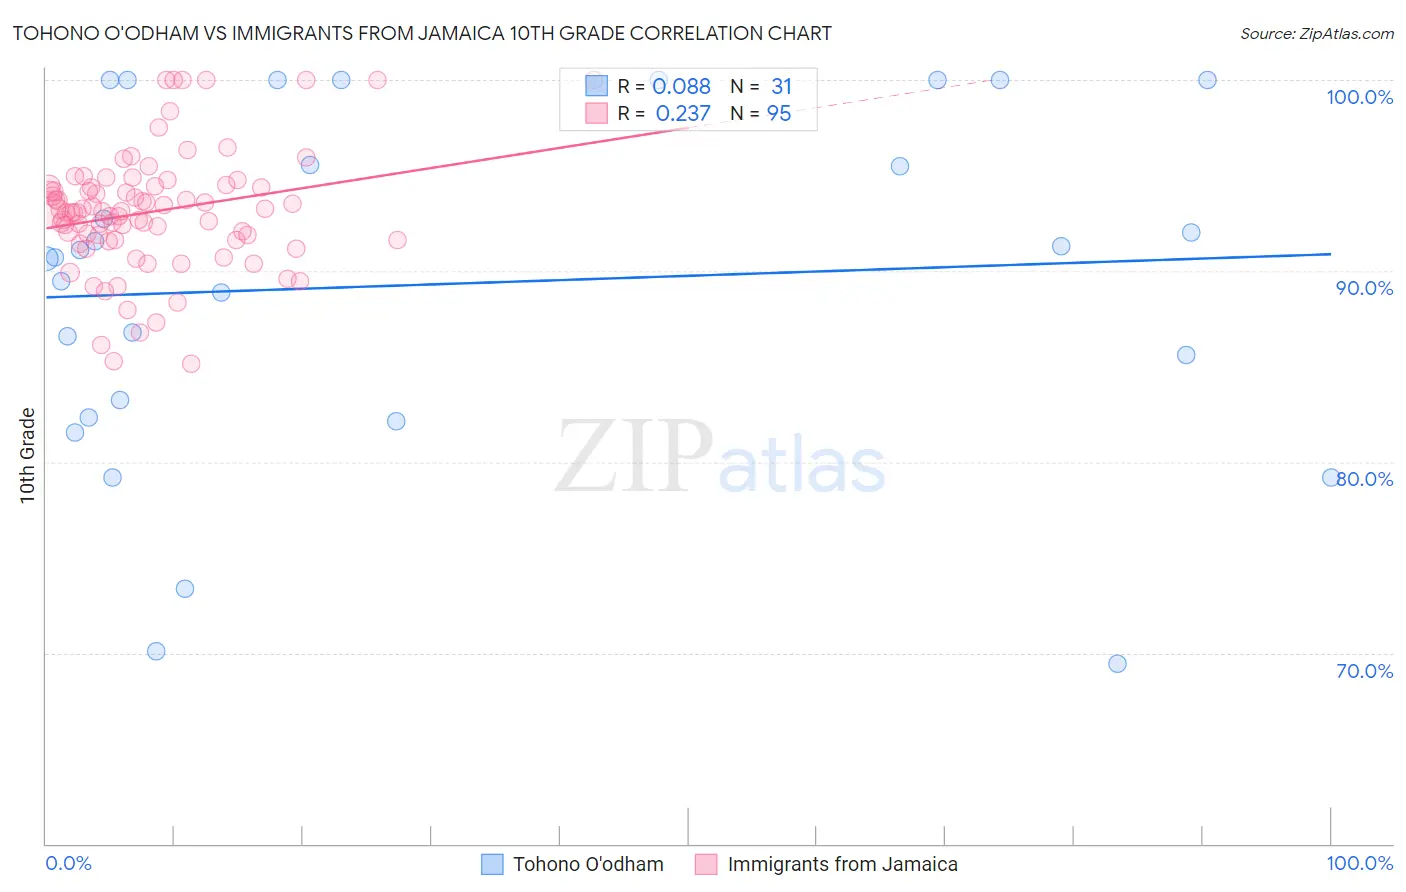
Tohono O'odham vs Immigrants from Jamaica 10th Grade Correlation Chart
The statistical analysis conducted on geographies consisting of 58,730,615 people shows a slight positive correlation between the proportion of Tohono O'odham and percentage of population with at least 10th grade education in the United States with a correlation coefficient (R) of 0.088 and weighted average of 90.1%. Similarly, the statistical analysis conducted on geographies consisting of 301,829,550 people shows a weak positive correlation between the proportion of Immigrants from Jamaica and percentage of population with at least 10th grade education in the United States with a correlation coefficient (R) of 0.237 and weighted average of 92.6%, a difference of 2.8%.
10th Grade Correlation Summary
| Measurement | Tohono O'odham | Immigrants from Jamaica |
| Minimum | 69.4% | 85.2% |
| Maximum | 100.0% | 100.0% |
| Range | 30.6% | 14.8% |
| Mean | 89.3% | 93.1% |
| Median | 90.7% | 93.1% |
| Interquartile 25% (IQ1) | 82.3% | 91.6% |
| Interquartile 75% (IQ3) | 100.0% | 94.4% |
| Interquartile Range (IQR) | 17.7% | 2.8% |
| Standard Deviation (Sample) | 9.1% | 3.1% |
| Standard Deviation (Population) | 8.9% | 3.1% |
Similar Demographics by 10th Grade
Demographics Similar to Tohono O'odham by 10th Grade
In terms of 10th grade, the demographic groups most similar to Tohono O'odham are Houma (90.2%, a difference of 0.010%), Belizean (90.2%, a difference of 0.010%), Nicaraguan (90.2%, a difference of 0.020%), Immigrants from Belize (90.1%, a difference of 0.090%), and Immigrants from Cuba (90.2%, a difference of 0.10%).
| Demographics | Rating | Rank | 10th Grade |
| Immigrants | Caribbean | 0.0 /100 | #315 | Tragic 90.6% |
| Ecuadorians | 0.0 /100 | #316 | Tragic 90.6% |
| Immigrants | Ecuador | 0.0 /100 | #317 | Tragic 90.4% |
| Immigrants | Cuba | 0.0 /100 | #318 | Tragic 90.2% |
| Nicaraguans | 0.0 /100 | #319 | Tragic 90.2% |
| Houma | 0.0 /100 | #320 | Tragic 90.2% |
| Belizeans | 0.0 /100 | #321 | Tragic 90.2% |
| Tohono O'odham | 0.0 /100 | #322 | Tragic 90.1% |
| Immigrants | Belize | 0.0 /100 | #323 | Tragic 90.1% |
| Immigrants | Armenia | 0.0 /100 | #324 | Tragic 89.9% |
| Puerto Ricans | 0.0 /100 | #325 | Tragic 89.8% |
| Central American Indians | 0.0 /100 | #326 | Tragic 89.7% |
| Immigrants | Nicaragua | 0.0 /100 | #327 | Tragic 89.5% |
| Immigrants | Cabo Verde | 0.0 /100 | #328 | Tragic 89.5% |
| Dominicans | 0.0 /100 | #329 | Tragic 89.4% |
Demographics Similar to Immigrants from Jamaica by 10th Grade
In terms of 10th grade, the demographic groups most similar to Immigrants from Jamaica are Immigrants from Uzbekistan (92.6%, a difference of 0.010%), U.S. Virgin Islander (92.7%, a difference of 0.040%), Immigrants from Costa Rica (92.7%, a difference of 0.040%), Paiute (92.6%, a difference of 0.050%), and Immigrants from Bolivia (92.7%, a difference of 0.060%).
| Demographics | Rating | Rank | 10th Grade |
| South Americans | 0.9 /100 | #252 | Tragic 92.8% |
| Ghanaians | 0.9 /100 | #253 | Tragic 92.8% |
| Armenians | 0.9 /100 | #254 | Tragic 92.7% |
| Immigrants | Bolivia | 0.7 /100 | #255 | Tragic 92.7% |
| Immigrants | Nigeria | 0.7 /100 | #256 | Tragic 92.7% |
| U.S. Virgin Islanders | 0.7 /100 | #257 | Tragic 92.7% |
| Immigrants | Costa Rica | 0.6 /100 | #258 | Tragic 92.7% |
| Immigrants | Jamaica | 0.5 /100 | #259 | Tragic 92.6% |
| Immigrants | Uzbekistan | 0.5 /100 | #260 | Tragic 92.6% |
| Paiute | 0.4 /100 | #261 | Tragic 92.6% |
| Immigrants | South America | 0.4 /100 | #262 | Tragic 92.6% |
| Apache | 0.4 /100 | #263 | Tragic 92.6% |
| Peruvians | 0.4 /100 | #264 | Tragic 92.6% |
| Dutch West Indians | 0.4 /100 | #265 | Tragic 92.6% |
| Immigrants | Philippines | 0.4 /100 | #266 | Tragic 92.6% |