Estonian vs Nepalese No Schooling Completed
COMPARE
Estonian
Nepalese
No Schooling Completed
No Schooling Completed Comparison
Estonians
Nepalese
1.6%
NO SCHOOLING COMPLETED
99.9/ 100
METRIC RATING
44th/ 347
METRIC RANK
3.8%
NO SCHOOLING COMPLETED
0.0/ 100
METRIC RATING
344th/ 347
METRIC RANK
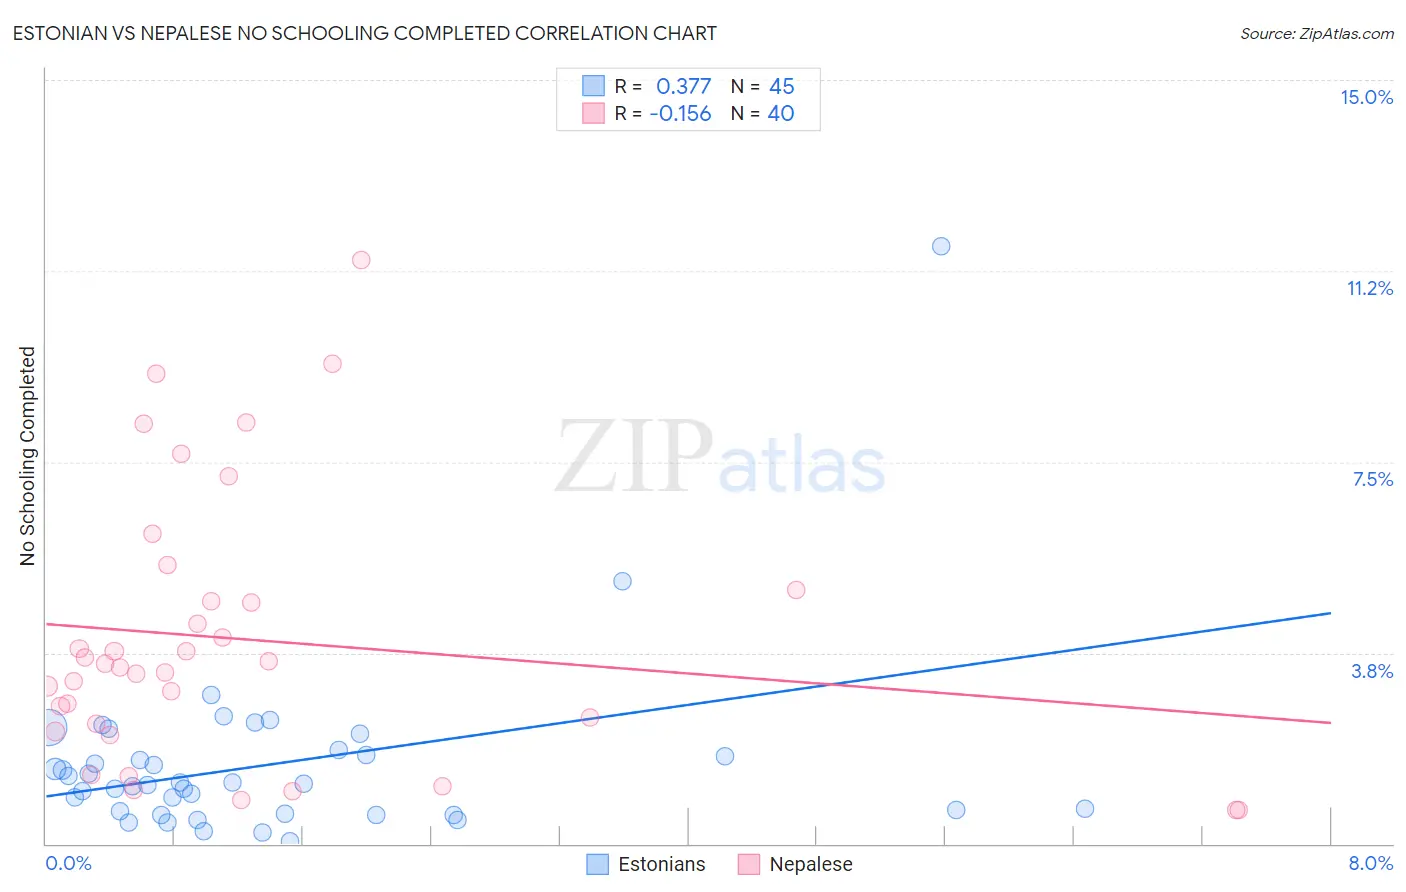
Estonian vs Nepalese No Schooling Completed Correlation Chart
The statistical analysis conducted on geographies consisting of 123,023,374 people shows a mild positive correlation between the proportion of Estonians and percentage of population with no schooling in the United States with a correlation coefficient (R) of 0.377 and weighted average of 1.6%. Similarly, the statistical analysis conducted on geographies consisting of 24,510,165 people shows a poor negative correlation between the proportion of Nepalese and percentage of population with no schooling in the United States with a correlation coefficient (R) of -0.156 and weighted average of 3.8%, a difference of 134.9%.
No Schooling Completed Correlation Summary
| Measurement | Estonian | Nepalese |
| Minimum | 0.039% | 0.66% |
| Maximum | 11.7% | 11.5% |
| Range | 11.7% | 10.8% |
| Mean | 1.6% | 4.0% |
| Median | 1.2% | 3.5% |
| Interquartile 25% (IQ1) | 0.62% | 2.3% |
| Interquartile 75% (IQ3) | 1.8% | 4.9% |
| Interquartile Range (IQR) | 1.2% | 2.6% |
| Standard Deviation (Sample) | 1.8% | 2.6% |
| Standard Deviation (Population) | 1.8% | 2.6% |
Similar Demographics by No Schooling Completed
Demographics Similar to Estonians by No Schooling Completed
In terms of no schooling completed, the demographic groups most similar to Estonians are Czechoslovakian (1.6%, a difference of 0.040%), Maltese (1.6%, a difference of 0.13%), Australian (1.6%, a difference of 0.19%), Ottawa (1.6%, a difference of 0.27%), and Bulgarian (1.6%, a difference of 0.31%).
| Demographics | Rating | Rank | No Schooling Completed |
| Belgians | 99.9 /100 | #37 | Exceptional 1.6% |
| Northern Europeans | 99.9 /100 | #38 | Exceptional 1.6% |
| Native Hawaiians | 99.9 /100 | #39 | Exceptional 1.6% |
| Luxembourgers | 99.9 /100 | #40 | Exceptional 1.6% |
| Hungarians | 99.9 /100 | #41 | Exceptional 1.6% |
| Bulgarians | 99.9 /100 | #42 | Exceptional 1.6% |
| Australians | 99.9 /100 | #43 | Exceptional 1.6% |
| Estonians | 99.9 /100 | #44 | Exceptional 1.6% |
| Czechoslovakians | 99.9 /100 | #45 | Exceptional 1.6% |
| Maltese | 99.9 /100 | #46 | Exceptional 1.6% |
| Ottawa | 99.9 /100 | #47 | Exceptional 1.6% |
| Immigrants | Scotland | 99.9 /100 | #48 | Exceptional 1.6% |
| Whites/Caucasians | 99.9 /100 | #49 | Exceptional 1.6% |
| Celtics | 99.9 /100 | #50 | Exceptional 1.6% |
| Chippewa | 99.8 /100 | #51 | Exceptional 1.6% |
Demographics Similar to Nepalese by No Schooling Completed
In terms of no schooling completed, the demographic groups most similar to Nepalese are Salvadoran (3.7%, a difference of 1.7%), Immigrants from El Salvador (3.9%, a difference of 1.8%), Immigrants from Mexico (3.6%, a difference of 4.5%), Immigrants from Central America (3.6%, a difference of 5.3%), and Immigrants from Guatemala (3.6%, a difference of 6.4%).
| Demographics | Rating | Rank | No Schooling Completed |
| Immigrants | Dominican Republic | 0.0 /100 | #333 | Tragic 3.4% |
| Guatemalans | 0.0 /100 | #334 | Tragic 3.5% |
| Immigrants | Cambodia | 0.0 /100 | #335 | Tragic 3.5% |
| Immigrants | Fiji | 0.0 /100 | #336 | Tragic 3.5% |
| Immigrants | Cabo Verde | 0.0 /100 | #337 | Tragic 3.5% |
| Bangladeshis | 0.0 /100 | #338 | Tragic 3.5% |
| Yakama | 0.0 /100 | #339 | Tragic 3.6% |
| Immigrants | Guatemala | 0.0 /100 | #340 | Tragic 3.6% |
| Immigrants | Central America | 0.0 /100 | #341 | Tragic 3.6% |
| Immigrants | Mexico | 0.0 /100 | #342 | Tragic 3.6% |
| Salvadorans | 0.0 /100 | #343 | Tragic 3.7% |
| Nepalese | 0.0 /100 | #344 | Tragic 3.8% |
| Immigrants | El Salvador | 0.0 /100 | #345 | Tragic 3.9% |
| Immigrants | Yemen | 0.0 /100 | #346 | Tragic 4.1% |
| Spanish American Indians | 0.0 /100 | #347 | Tragic 4.2% |