Immigrants from Africa vs Lumbee 9th Grade
COMPARE
Immigrants from Africa
Lumbee
9th Grade
9th Grade Comparison
Immigrants from Africa
Lumbee
94.3%
9TH GRADE
3.9/ 100
METRIC RATING
232nd/ 347
METRIC RANK
94.4%
9TH GRADE
4.7/ 100
METRIC RATING
228th/ 347
METRIC RANK
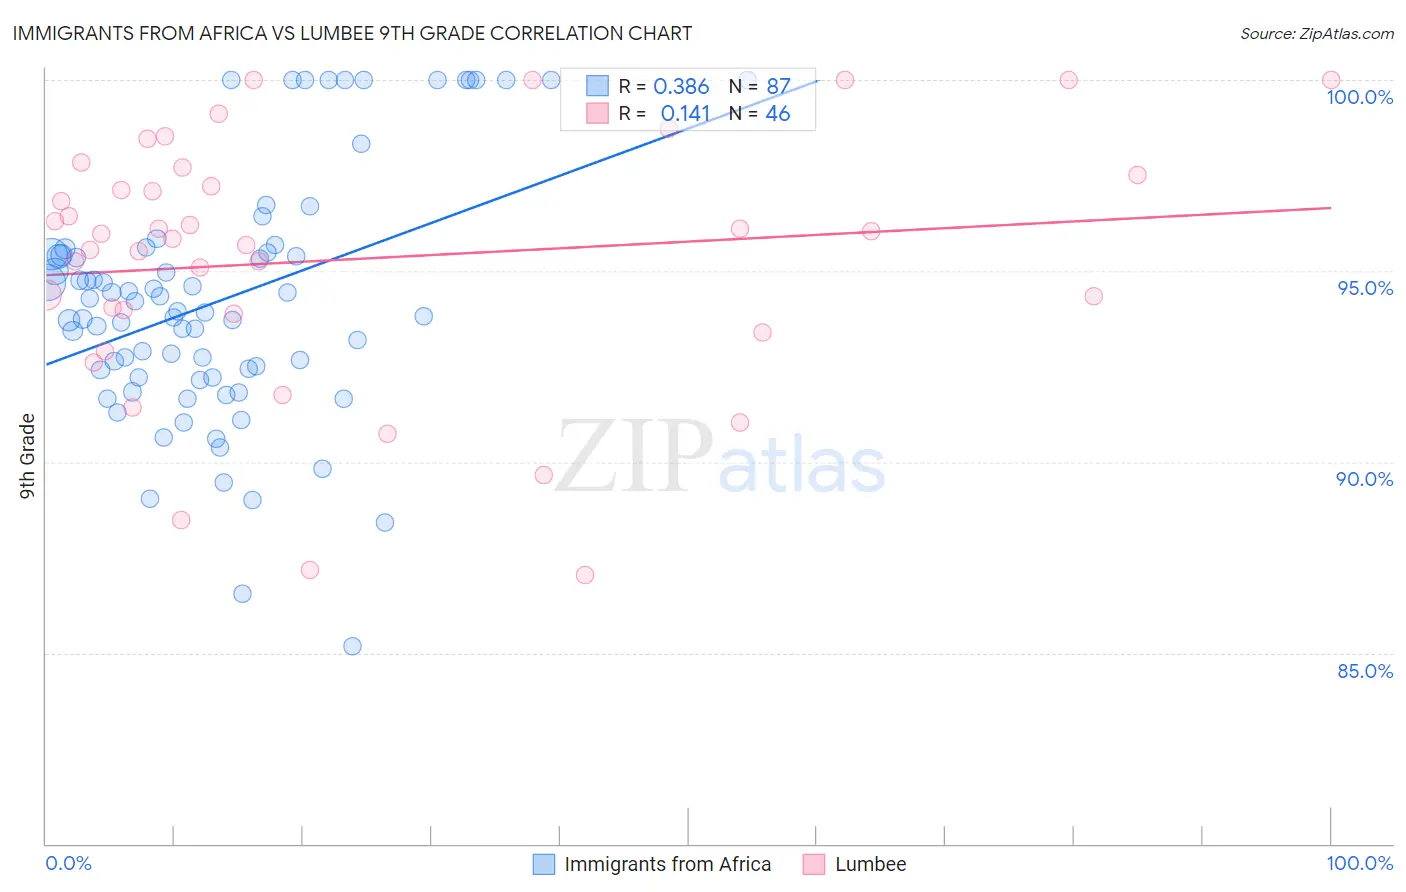
Immigrants from Africa vs Lumbee 9th Grade Correlation Chart
The statistical analysis conducted on geographies consisting of 469,381,733 people shows a mild positive correlation between the proportion of Immigrants from Africa and percentage of population with at least 9th grade education in the United States with a correlation coefficient (R) of 0.386 and weighted average of 94.3%. Similarly, the statistical analysis conducted on geographies consisting of 92,298,865 people shows a poor positive correlation between the proportion of Lumbee and percentage of population with at least 9th grade education in the United States with a correlation coefficient (R) of 0.141 and weighted average of 94.4%, a difference of 0.040%.
9th Grade Correlation Summary
| Measurement | Immigrants from Africa | Lumbee |
| Minimum | 85.2% | 87.0% |
| Maximum | 100.0% | 100.0% |
| Range | 14.8% | 13.0% |
| Mean | 94.2% | 95.3% |
| Median | 93.9% | 95.9% |
| Interquartile 25% (IQ1) | 92.2% | 93.9% |
| Interquartile 75% (IQ3) | 95.5% | 97.5% |
| Interquartile Range (IQR) | 3.3% | 3.6% |
| Standard Deviation (Sample) | 3.2% | 3.3% |
| Standard Deviation (Population) | 3.2% | 3.3% |
Demographics Similar to Immigrants from Africa and Lumbee by 9th Grade
In terms of 9th grade, the demographic groups most similar to Immigrants from Africa are Apache (94.3%, a difference of 0.010%), Immigrants from Panama (94.3%, a difference of 0.010%), Nigerian (94.3%, a difference of 0.010%), Costa Rican (94.3%, a difference of 0.020%), and Immigrants from Southern Europe (94.3%, a difference of 0.030%). Similarly, the demographic groups most similar to Lumbee are Immigrants from Sierra Leone (94.4%, a difference of 0.0%), Immigrants from Southern Europe (94.3%, a difference of 0.010%), Apache (94.3%, a difference of 0.020%), Ethiopian (94.4%, a difference of 0.030%), and Subsaharan African (94.4%, a difference of 0.030%).
| Demographics | Rating | Rank | 9th Grade |
| Indians (Asian) | 8.6 /100 | #220 | Tragic 94.5% |
| Immigrants | Eastern Africa | 8.2 /100 | #221 | Tragic 94.5% |
| Immigrants | Asia | 7.7 /100 | #222 | Tragic 94.4% |
| Bahamians | 7.0 /100 | #223 | Tragic 94.4% |
| Tongans | 6.0 /100 | #224 | Tragic 94.4% |
| Ethiopians | 5.4 /100 | #225 | Tragic 94.4% |
| Sub-Saharan Africans | 5.4 /100 | #226 | Tragic 94.4% |
| Immigrants | Sierra Leone | 4.8 /100 | #227 | Tragic 94.4% |
| Lumbee | 4.7 /100 | #228 | Tragic 94.4% |
| Immigrants | Southern Europe | 4.5 /100 | #229 | Tragic 94.3% |
| Apache | 4.2 /100 | #230 | Tragic 94.3% |
| Immigrants | Panama | 4.0 /100 | #231 | Tragic 94.3% |
| Immigrants | Africa | 3.9 /100 | #232 | Tragic 94.3% |
| Nigerians | 3.7 /100 | #233 | Tragic 94.3% |
| Costa Ricans | 3.5 /100 | #234 | Tragic 94.3% |
| Bolivians | 3.3 /100 | #235 | Tragic 94.3% |
| Somalis | 2.9 /100 | #236 | Tragic 94.3% |
| Koreans | 2.9 /100 | #237 | Tragic 94.3% |
| South American Indians | 2.8 /100 | #238 | Tragic 94.3% |
| Immigrants | China | 2.8 /100 | #239 | Tragic 94.3% |
| Immigrants | Ethiopia | 2.7 /100 | #240 | Tragic 94.3% |