Carpatho Rusyn vs Lumbee 9th Grade
COMPARE
Carpatho Rusyn
Lumbee
9th Grade
9th Grade Comparison
Carpatho Rusyns
Lumbee
96.7%
9TH GRADE
100.0/ 100
METRIC RATING
7th/ 347
METRIC RANK
94.4%
9TH GRADE
4.7/ 100
METRIC RATING
228th/ 347
METRIC RANK
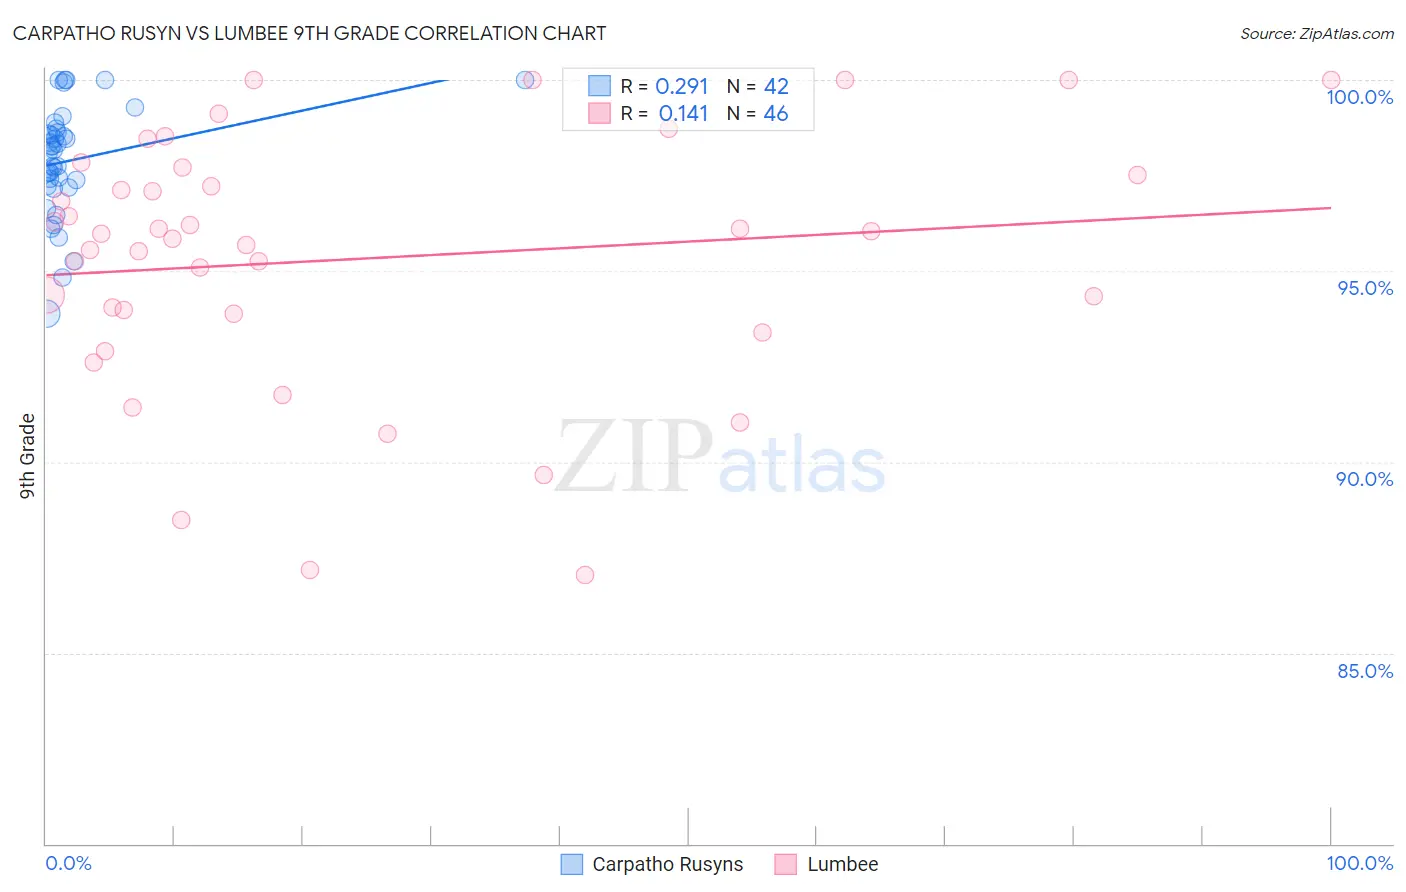
Carpatho Rusyn vs Lumbee 9th Grade Correlation Chart
The statistical analysis conducted on geographies consisting of 58,871,690 people shows a weak positive correlation between the proportion of Carpatho Rusyns and percentage of population with at least 9th grade education in the United States with a correlation coefficient (R) of 0.291 and weighted average of 96.7%. Similarly, the statistical analysis conducted on geographies consisting of 92,298,865 people shows a poor positive correlation between the proportion of Lumbee and percentage of population with at least 9th grade education in the United States with a correlation coefficient (R) of 0.141 and weighted average of 94.4%, a difference of 2.5%.
9th Grade Correlation Summary
| Measurement | Carpatho Rusyn | Lumbee |
| Minimum | 93.9% | 87.0% |
| Maximum | 100.0% | 100.0% |
| Range | 6.1% | 13.0% |
| Mean | 97.9% | 95.3% |
| Median | 98.1% | 95.9% |
| Interquartile 25% (IQ1) | 97.2% | 93.9% |
| Interquartile 75% (IQ3) | 98.6% | 97.5% |
| Interquartile Range (IQR) | 1.4% | 3.6% |
| Standard Deviation (Sample) | 1.4% | 3.3% |
| Standard Deviation (Population) | 1.4% | 3.3% |
Similar Demographics by 9th Grade
Demographics Similar to Carpatho Rusyns by 9th Grade
In terms of 9th grade, the demographic groups most similar to Carpatho Rusyns are Swedish (96.7%, a difference of 0.010%), Polish (96.7%, a difference of 0.010%), German (96.7%, a difference of 0.010%), Slovene (96.7%, a difference of 0.020%), and Tlingit-Haida (96.6%, a difference of 0.090%).
| Demographics | Rating | Rank | 9th Grade |
| Tsimshian | 100.0 /100 | #1 | Exceptional 97.0% |
| Norwegians | 100.0 /100 | #2 | Exceptional 96.9% |
| Slovaks | 100.0 /100 | #3 | Exceptional 96.9% |
| Slovenes | 100.0 /100 | #4 | Exceptional 96.7% |
| Swedes | 100.0 /100 | #5 | Exceptional 96.7% |
| Poles | 100.0 /100 | #6 | Exceptional 96.7% |
| Carpatho Rusyns | 100.0 /100 | #7 | Exceptional 96.7% |
| Germans | 100.0 /100 | #8 | Exceptional 96.7% |
| Tlingit-Haida | 100.0 /100 | #9 | Exceptional 96.6% |
| Lithuanians | 100.0 /100 | #10 | Exceptional 96.6% |
| Finns | 100.0 /100 | #11 | Exceptional 96.6% |
| English | 100.0 /100 | #12 | Exceptional 96.6% |
| Danes | 100.0 /100 | #13 | Exceptional 96.5% |
| Scottish | 100.0 /100 | #14 | Exceptional 96.5% |
| Irish | 100.0 /100 | #15 | Exceptional 96.5% |
Demographics Similar to Lumbee by 9th Grade
In terms of 9th grade, the demographic groups most similar to Lumbee are Immigrants from Sierra Leone (94.4%, a difference of 0.0%), Immigrants from Southern Europe (94.3%, a difference of 0.010%), Apache (94.3%, a difference of 0.020%), Ethiopian (94.4%, a difference of 0.030%), and Subsaharan African (94.4%, a difference of 0.030%).
| Demographics | Rating | Rank | 9th Grade |
| Immigrants | Eastern Africa | 8.2 /100 | #221 | Tragic 94.5% |
| Immigrants | Asia | 7.7 /100 | #222 | Tragic 94.4% |
| Bahamians | 7.0 /100 | #223 | Tragic 94.4% |
| Tongans | 6.0 /100 | #224 | Tragic 94.4% |
| Ethiopians | 5.4 /100 | #225 | Tragic 94.4% |
| Sub-Saharan Africans | 5.4 /100 | #226 | Tragic 94.4% |
| Immigrants | Sierra Leone | 4.8 /100 | #227 | Tragic 94.4% |
| Lumbee | 4.7 /100 | #228 | Tragic 94.4% |
| Immigrants | Southern Europe | 4.5 /100 | #229 | Tragic 94.3% |
| Apache | 4.2 /100 | #230 | Tragic 94.3% |
| Immigrants | Panama | 4.0 /100 | #231 | Tragic 94.3% |
| Immigrants | Africa | 3.9 /100 | #232 | Tragic 94.3% |
| Nigerians | 3.7 /100 | #233 | Tragic 94.3% |
| Costa Ricans | 3.5 /100 | #234 | Tragic 94.3% |
| Bolivians | 3.3 /100 | #235 | Tragic 94.3% |