Tohono O'odham vs Immigrants from Zaire 6th Grade
COMPARE
Tohono O'odham
Immigrants from Zaire
6th Grade
6th Grade Comparison
Tohono O'odham
Immigrants from Zaire
96.5%
6TH GRADE
1.0/ 100
METRIC RATING
248th/ 347
METRIC RANK
96.9%
6TH GRADE
14.5/ 100
METRIC RATING
201st/ 347
METRIC RANK
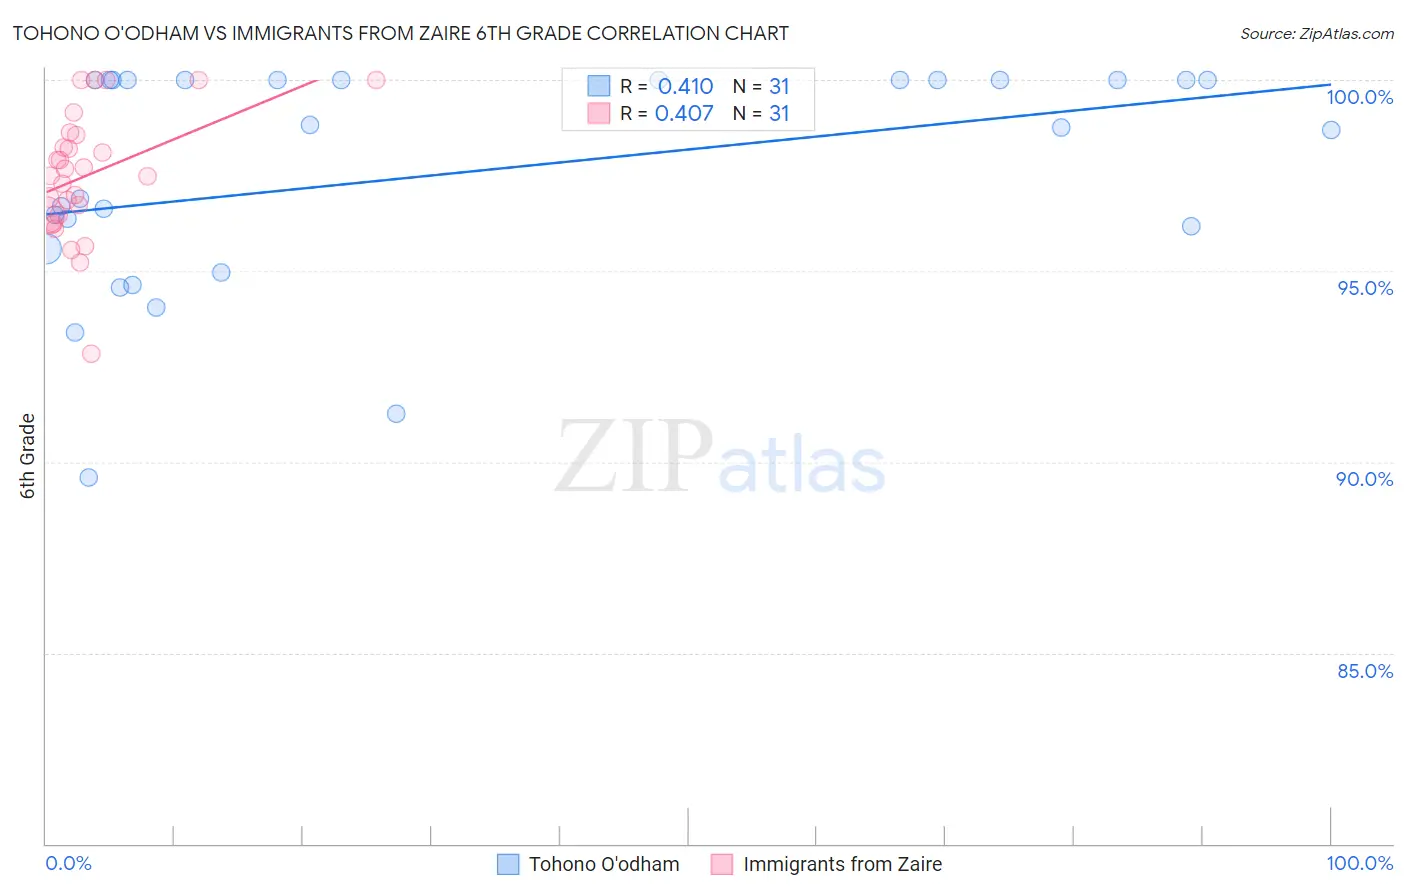
Tohono O'odham vs Immigrants from Zaire 6th Grade Correlation Chart
The statistical analysis conducted on geographies consisting of 58,730,615 people shows a moderate positive correlation between the proportion of Tohono O'odham and percentage of population with at least 6th grade education in the United States with a correlation coefficient (R) of 0.410 and weighted average of 96.5%. Similarly, the statistical analysis conducted on geographies consisting of 107,212,695 people shows a moderate positive correlation between the proportion of Immigrants from Zaire and percentage of population with at least 6th grade education in the United States with a correlation coefficient (R) of 0.407 and weighted average of 96.9%, a difference of 0.33%.
6th Grade Correlation Summary
| Measurement | Tohono O'odham | Immigrants from Zaire |
| Minimum | 89.6% | 92.8% |
| Maximum | 100.0% | 100.0% |
| Range | 10.4% | 7.2% |
| Mean | 97.5% | 97.5% |
| Median | 98.8% | 97.5% |
| Interquartile 25% (IQ1) | 95.6% | 96.5% |
| Interquartile 75% (IQ3) | 100.0% | 98.6% |
| Interquartile Range (IQR) | 4.4% | 2.1% |
| Standard Deviation (Sample) | 2.9% | 1.6% |
| Standard Deviation (Population) | 2.9% | 1.6% |
Similar Demographics by 6th Grade
Demographics Similar to Tohono O'odham by 6th Grade
In terms of 6th grade, the demographic groups most similar to Tohono O'odham are Bolivian (96.5%, a difference of 0.0%), Colombian (96.5%, a difference of 0.0%), Immigrants from Middle Africa (96.5%, a difference of 0.020%), Immigrants from Costa Rica (96.6%, a difference of 0.040%), and Immigrants from Africa (96.6%, a difference of 0.040%).
| Demographics | Rating | Rank | 6th Grade |
| Senegalese | 1.8 /100 | #241 | Tragic 96.6% |
| Immigrants | Asia | 1.8 /100 | #242 | Tragic 96.6% |
| Immigrants | Liberia | 1.6 /100 | #243 | Tragic 96.6% |
| Ethiopians | 1.5 /100 | #244 | Tragic 96.6% |
| Immigrants | Costa Rica | 1.3 /100 | #245 | Tragic 96.6% |
| Immigrants | Africa | 1.3 /100 | #246 | Tragic 96.6% |
| Bolivians | 1.0 /100 | #247 | Tragic 96.5% |
| Tohono O'odham | 1.0 /100 | #248 | Tragic 96.5% |
| Colombians | 0.9 /100 | #249 | Tragic 96.5% |
| Immigrants | Middle Africa | 0.8 /100 | #250 | Tragic 96.5% |
| Immigrants | Senegal | 0.7 /100 | #251 | Tragic 96.5% |
| Immigrants | Uruguay | 0.6 /100 | #252 | Tragic 96.5% |
| Jamaicans | 0.6 /100 | #253 | Tragic 96.5% |
| Immigrants | Ethiopia | 0.6 /100 | #254 | Tragic 96.5% |
| Immigrants | Congo | 0.6 /100 | #255 | Tragic 96.5% |
Demographics Similar to Immigrants from Zaire by 6th Grade
In terms of 6th grade, the demographic groups most similar to Immigrants from Zaire are African (96.9%, a difference of 0.0%), Immigrants from Chile (96.8%, a difference of 0.0%), Immigrants from Northern Africa (96.9%, a difference of 0.010%), Sudanese (96.8%, a difference of 0.010%), and Immigrants from Bahamas (96.8%, a difference of 0.010%).
| Demographics | Rating | Rank | 6th Grade |
| Immigrants | Lebanon | 25.6 /100 | #194 | Fair 96.9% |
| Immigrants | Brazil | 25.5 /100 | #195 | Fair 96.9% |
| Immigrants | Uganda | 21.2 /100 | #196 | Fair 96.9% |
| Brazilians | 20.1 /100 | #197 | Fair 96.9% |
| Immigrants | Albania | 18.8 /100 | #198 | Poor 96.9% |
| Immigrants | Northern Africa | 15.7 /100 | #199 | Poor 96.9% |
| Africans | 14.8 /100 | #200 | Poor 96.9% |
| Immigrants | Zaire | 14.5 /100 | #201 | Poor 96.9% |
| Immigrants | Chile | 14.2 /100 | #202 | Poor 96.8% |
| Sudanese | 13.9 /100 | #203 | Poor 96.8% |
| Immigrants | Bahamas | 13.8 /100 | #204 | Poor 96.8% |
| Natives/Alaskans | 13.0 /100 | #205 | Poor 96.8% |
| Laotians | 11.8 /100 | #206 | Poor 96.8% |
| Iraqis | 11.7 /100 | #207 | Poor 96.8% |
| Samoans | 11.0 /100 | #208 | Poor 96.8% |