Immigrants from Morocco vs Immigrants from Zaire 6th Grade
COMPARE
Immigrants from Morocco
Immigrants from Zaire
6th Grade
6th Grade Comparison
Immigrants from Morocco
Immigrants from Zaire
96.7%
6TH GRADE
6.2/ 100
METRIC RATING
220th/ 347
METRIC RANK
96.9%
6TH GRADE
14.5/ 100
METRIC RATING
201st/ 347
METRIC RANK
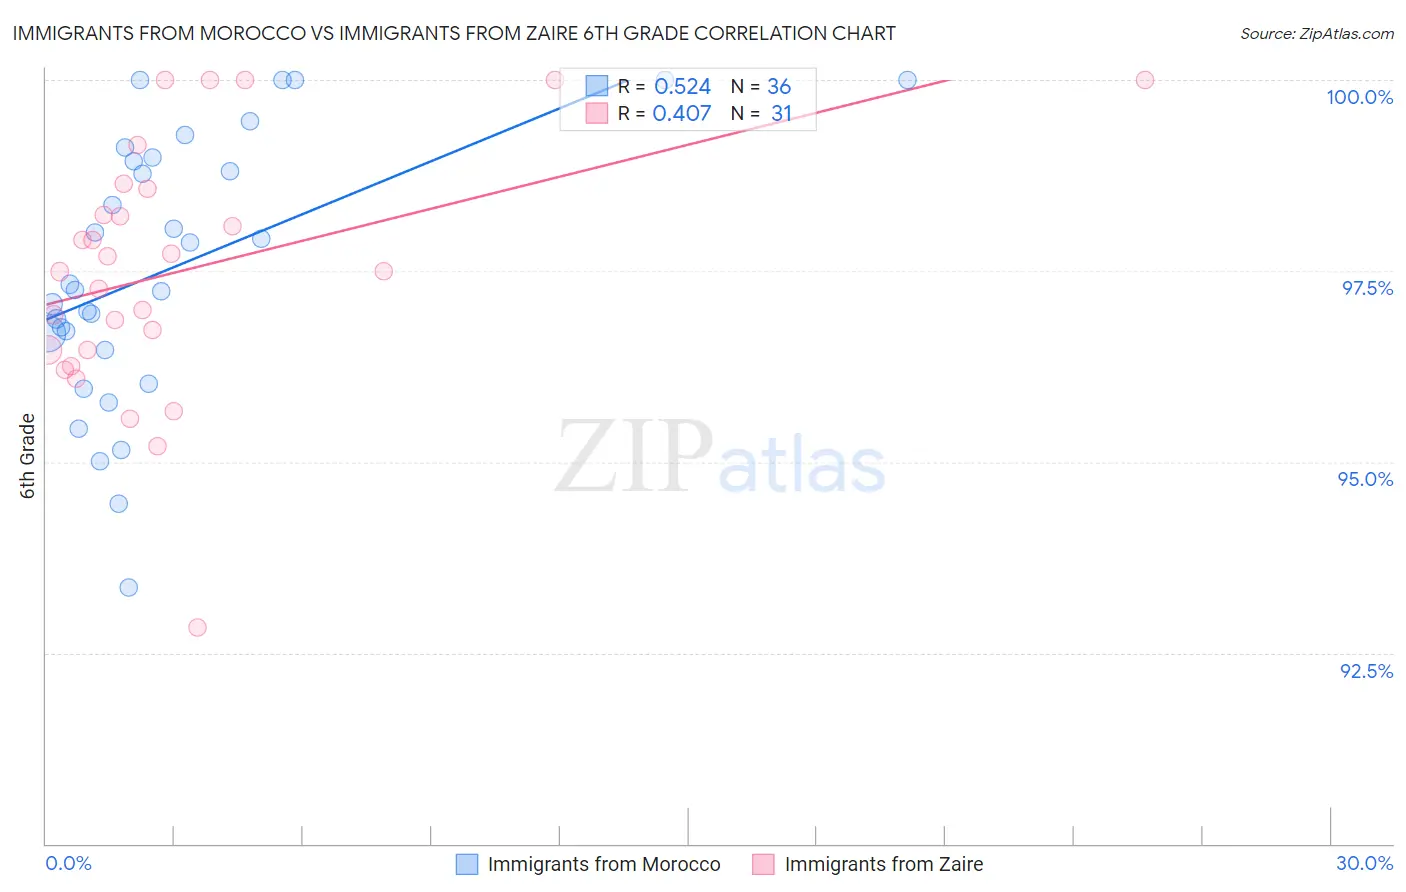
Immigrants from Morocco vs Immigrants from Zaire 6th Grade Correlation Chart
The statistical analysis conducted on geographies consisting of 178,910,634 people shows a substantial positive correlation between the proportion of Immigrants from Morocco and percentage of population with at least 6th grade education in the United States with a correlation coefficient (R) of 0.524 and weighted average of 96.7%. Similarly, the statistical analysis conducted on geographies consisting of 107,212,695 people shows a moderate positive correlation between the proportion of Immigrants from Zaire and percentage of population with at least 6th grade education in the United States with a correlation coefficient (R) of 0.407 and weighted average of 96.9%, a difference of 0.11%.
6th Grade Correlation Summary
| Measurement | Immigrants from Morocco | Immigrants from Zaire |
| Minimum | 93.4% | 92.8% |
| Maximum | 100.0% | 100.0% |
| Range | 6.6% | 7.2% |
| Mean | 97.5% | 97.5% |
| Median | 97.3% | 97.5% |
| Interquartile 25% (IQ1) | 96.6% | 96.5% |
| Interquartile 75% (IQ3) | 99.0% | 98.6% |
| Interquartile Range (IQR) | 2.4% | 2.1% |
| Standard Deviation (Sample) | 1.7% | 1.6% |
| Standard Deviation (Population) | 1.7% | 1.6% |
Demographics Similar to Immigrants from Morocco and Immigrants from Zaire by 6th Grade
In terms of 6th grade, the demographic groups most similar to Immigrants from Morocco are Costa Rican (96.8%, a difference of 0.010%), Liberian (96.8%, a difference of 0.020%), Navajo (96.8%, a difference of 0.020%), Sierra Leonean (96.8%, a difference of 0.030%), and Paiute (96.8%, a difference of 0.030%). Similarly, the demographic groups most similar to Immigrants from Zaire are African (96.9%, a difference of 0.0%), Immigrants from Chile (96.8%, a difference of 0.0%), Sudanese (96.8%, a difference of 0.010%), Immigrants from Bahamas (96.8%, a difference of 0.010%), and Native/Alaskan (96.8%, a difference of 0.010%).
| Demographics | Rating | Rank | 6th Grade |
| Africans | 14.8 /100 | #200 | Poor 96.9% |
| Immigrants | Zaire | 14.5 /100 | #201 | Poor 96.9% |
| Immigrants | Chile | 14.2 /100 | #202 | Poor 96.8% |
| Sudanese | 13.9 /100 | #203 | Poor 96.8% |
| Immigrants | Bahamas | 13.8 /100 | #204 | Poor 96.8% |
| Natives/Alaskans | 13.0 /100 | #205 | Poor 96.8% |
| Laotians | 11.8 /100 | #206 | Poor 96.8% |
| Iraqis | 11.7 /100 | #207 | Poor 96.8% |
| Samoans | 11.0 /100 | #208 | Poor 96.8% |
| Immigrants | Oceania | 11.0 /100 | #209 | Poor 96.8% |
| Immigrants | Nepal | 10.1 /100 | #210 | Poor 96.8% |
| Immigrants | Iraq | 9.2 /100 | #211 | Tragic 96.8% |
| Moroccans | 9.0 /100 | #212 | Tragic 96.8% |
| Immigrants | Sudan | 8.7 /100 | #213 | Tragic 96.8% |
| Portuguese | 8.2 /100 | #214 | Tragic 96.8% |
| Sierra Leoneans | 8.0 /100 | #215 | Tragic 96.8% |
| Paiute | 7.8 /100 | #216 | Tragic 96.8% |
| Liberians | 7.5 /100 | #217 | Tragic 96.8% |
| Navajo | 7.3 /100 | #218 | Tragic 96.8% |
| Costa Ricans | 6.8 /100 | #219 | Tragic 96.8% |
| Immigrants | Morocco | 6.2 /100 | #220 | Tragic 96.7% |