Immigrants from Somalia vs Immigrants from Zaire 6th Grade
COMPARE
Immigrants from Somalia
Immigrants from Zaire
6th Grade
6th Grade Comparison
Immigrants from Somalia
Immigrants from Zaire
96.1%
6TH GRADE
0.0/ 100
METRIC RATING
290th/ 347
METRIC RANK
96.9%
6TH GRADE
14.5/ 100
METRIC RATING
201st/ 347
METRIC RANK
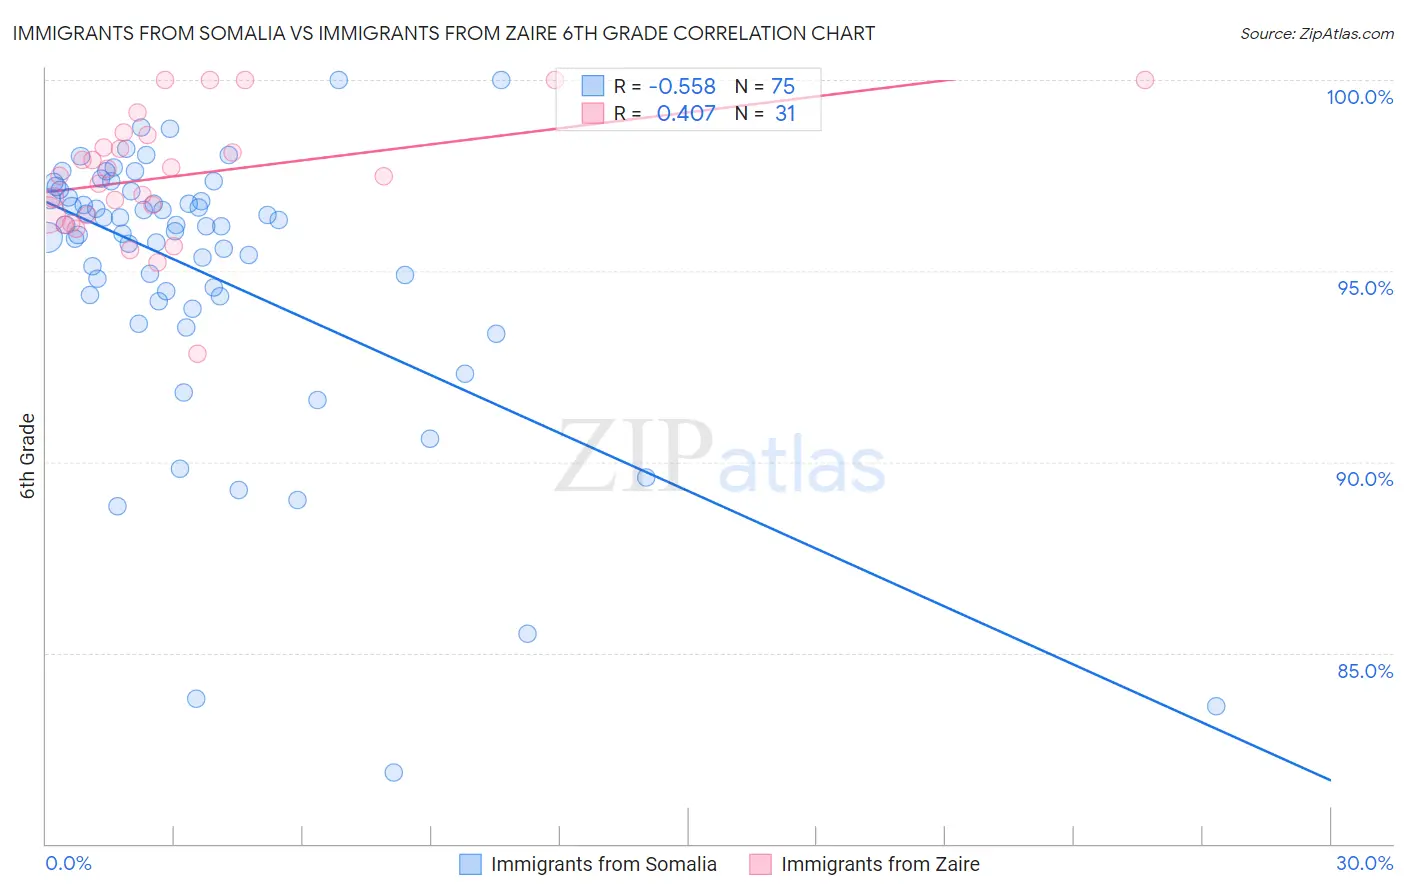
Immigrants from Somalia vs Immigrants from Zaire 6th Grade Correlation Chart
The statistical analysis conducted on geographies consisting of 92,109,166 people shows a substantial negative correlation between the proportion of Immigrants from Somalia and percentage of population with at least 6th grade education in the United States with a correlation coefficient (R) of -0.558 and weighted average of 96.1%. Similarly, the statistical analysis conducted on geographies consisting of 107,212,695 people shows a moderate positive correlation between the proportion of Immigrants from Zaire and percentage of population with at least 6th grade education in the United States with a correlation coefficient (R) of 0.407 and weighted average of 96.9%, a difference of 0.76%.
6th Grade Correlation Summary
| Measurement | Immigrants from Somalia | Immigrants from Zaire |
| Minimum | 81.9% | 92.8% |
| Maximum | 100.0% | 100.0% |
| Range | 18.1% | 7.2% |
| Mean | 95.0% | 97.5% |
| Median | 96.2% | 97.5% |
| Interquartile 25% (IQ1) | 94.4% | 96.5% |
| Interquartile 75% (IQ3) | 97.1% | 98.6% |
| Interquartile Range (IQR) | 2.7% | 2.1% |
| Standard Deviation (Sample) | 3.6% | 1.6% |
| Standard Deviation (Population) | 3.6% | 1.6% |
Similar Demographics by 6th Grade
Demographics Similar to Immigrants from Somalia by 6th Grade
In terms of 6th grade, the demographic groups most similar to Immigrants from Somalia are Immigrants from St. Vincent and the Grenadines (96.1%, a difference of 0.0%), Immigrants from Eritrea (96.1%, a difference of 0.020%), Immigrants from Barbados (96.1%, a difference of 0.020%), Malaysian (96.2%, a difference of 0.040%), and Immigrants from Trinidad and Tobago (96.2%, a difference of 0.050%).
| Demographics | Rating | Rank | 6th Grade |
| Cubans | 0.1 /100 | #283 | Tragic 96.2% |
| Fijians | 0.1 /100 | #284 | Tragic 96.2% |
| Somalis | 0.1 /100 | #285 | Tragic 96.2% |
| Barbadians | 0.0 /100 | #286 | Tragic 96.2% |
| Immigrants | Trinidad and Tobago | 0.0 /100 | #287 | Tragic 96.2% |
| Malaysians | 0.0 /100 | #288 | Tragic 96.2% |
| Immigrants | Eritrea | 0.0 /100 | #289 | Tragic 96.1% |
| Immigrants | Somalia | 0.0 /100 | #290 | Tragic 96.1% |
| Immigrants | St. Vincent and the Grenadines | 0.0 /100 | #291 | Tragic 96.1% |
| Immigrants | Barbados | 0.0 /100 | #292 | Tragic 96.1% |
| Immigrants | West Indies | 0.0 /100 | #293 | Tragic 96.1% |
| British West Indians | 0.0 /100 | #294 | Tragic 96.0% |
| Immigrants | Grenada | 0.0 /100 | #295 | Tragic 95.9% |
| Immigrants | South Eastern Asia | 0.0 /100 | #296 | Tragic 95.9% |
| Haitians | 0.0 /100 | #297 | Tragic 95.8% |
Demographics Similar to Immigrants from Zaire by 6th Grade
In terms of 6th grade, the demographic groups most similar to Immigrants from Zaire are African (96.9%, a difference of 0.0%), Immigrants from Chile (96.8%, a difference of 0.0%), Immigrants from Northern Africa (96.9%, a difference of 0.010%), Sudanese (96.8%, a difference of 0.010%), and Immigrants from Bahamas (96.8%, a difference of 0.010%).
| Demographics | Rating | Rank | 6th Grade |
| Immigrants | Lebanon | 25.6 /100 | #194 | Fair 96.9% |
| Immigrants | Brazil | 25.5 /100 | #195 | Fair 96.9% |
| Immigrants | Uganda | 21.2 /100 | #196 | Fair 96.9% |
| Brazilians | 20.1 /100 | #197 | Fair 96.9% |
| Immigrants | Albania | 18.8 /100 | #198 | Poor 96.9% |
| Immigrants | Northern Africa | 15.7 /100 | #199 | Poor 96.9% |
| Africans | 14.8 /100 | #200 | Poor 96.9% |
| Immigrants | Zaire | 14.5 /100 | #201 | Poor 96.9% |
| Immigrants | Chile | 14.2 /100 | #202 | Poor 96.8% |
| Sudanese | 13.9 /100 | #203 | Poor 96.8% |
| Immigrants | Bahamas | 13.8 /100 | #204 | Poor 96.8% |
| Natives/Alaskans | 13.0 /100 | #205 | Poor 96.8% |
| Laotians | 11.8 /100 | #206 | Poor 96.8% |
| Iraqis | 11.7 /100 | #207 | Poor 96.8% |
| Samoans | 11.0 /100 | #208 | Poor 96.8% |