Tohono O'odham vs Immigrants from Zaire Cognitive Disability
COMPARE
Tohono O'odham
Immigrants from Zaire
Cognitive Disability
Cognitive Disability Comparison
Tohono O'odham
Immigrants from Zaire
19.3%
COGNITIVE DISABILITY
0.0/ 100
METRIC RATING
341st/ 347
METRIC RANK
19.4%
COGNITIVE DISABILITY
0.0/ 100
METRIC RATING
343rd/ 347
METRIC RANK
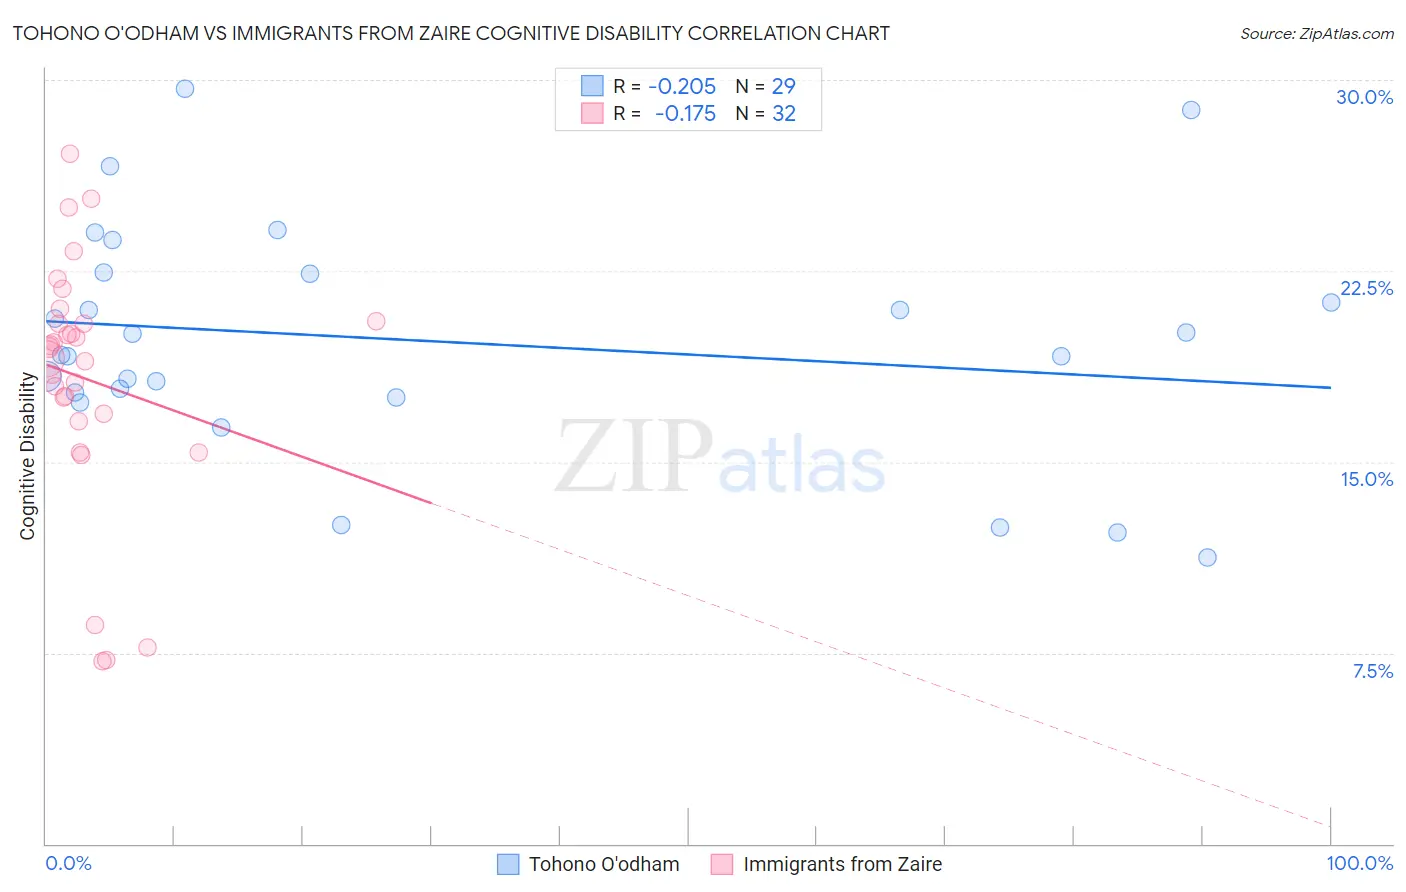
Tohono O'odham vs Immigrants from Zaire Cognitive Disability Correlation Chart
The statistical analysis conducted on geographies consisting of 58,725,044 people shows a weak negative correlation between the proportion of Tohono O'odham and percentage of population with cognitive disability in the United States with a correlation coefficient (R) of -0.205 and weighted average of 19.3%. Similarly, the statistical analysis conducted on geographies consisting of 107,255,223 people shows a poor negative correlation between the proportion of Immigrants from Zaire and percentage of population with cognitive disability in the United States with a correlation coefficient (R) of -0.175 and weighted average of 19.4%, a difference of 0.69%.
Cognitive Disability Correlation Summary
| Measurement | Tohono O'odham | Immigrants from Zaire |
| Minimum | 11.2% | 7.2% |
| Maximum | 29.7% | 27.1% |
| Range | 18.4% | 19.9% |
| Mean | 19.8% | 18.2% |
| Median | 19.2% | 19.3% |
| Interquartile 25% (IQ1) | 17.6% | 16.8% |
| Interquartile 75% (IQ3) | 22.4% | 20.5% |
| Interquartile Range (IQR) | 4.8% | 3.7% |
| Standard Deviation (Sample) | 4.5% | 4.9% |
| Standard Deviation (Population) | 4.4% | 4.8% |
Demographics Similar to Tohono O'odham and Immigrants from Zaire by Cognitive Disability
In terms of cognitive disability, the demographic groups most similar to Tohono O'odham are Houma (19.3%, a difference of 0.0%), Cape Verdean (19.2%, a difference of 0.24%), Puerto Rican (19.2%, a difference of 0.26%), Lumbee (19.1%, a difference of 0.74%), and Immigrants from Saudi Arabia (19.1%, a difference of 1.1%). Similarly, the demographic groups most similar to Immigrants from Zaire are Houma (19.3%, a difference of 0.69%), Cape Verdean (19.2%, a difference of 0.93%), Puerto Rican (19.2%, a difference of 0.96%), Lumbee (19.1%, a difference of 1.4%), and Immigrants from Congo (19.7%, a difference of 1.6%).
| Demographics | Rating | Rank | Cognitive Disability |
| Kiowa | 0.0 /100 | #328 | Tragic 18.7% |
| Navajo | 0.0 /100 | #329 | Tragic 18.8% |
| Immigrants | Dominican Republic | 0.0 /100 | #330 | Tragic 18.8% |
| Pima | 0.0 /100 | #331 | Tragic 18.8% |
| Immigrants | Sudan | 0.0 /100 | #332 | Tragic 18.8% |
| Immigrants | Yemen | 0.0 /100 | #333 | Tragic 18.8% |
| Sudanese | 0.0 /100 | #334 | Tragic 18.9% |
| Senegalese | 0.0 /100 | #335 | Tragic 19.0% |
| Blacks/African Americans | 0.0 /100 | #336 | Tragic 19.0% |
| Immigrants | Saudi Arabia | 0.0 /100 | #337 | Tragic 19.1% |
| Lumbee | 0.0 /100 | #338 | Tragic 19.1% |
| Puerto Ricans | 0.0 /100 | #339 | Tragic 19.2% |
| Cape Verdeans | 0.0 /100 | #340 | Tragic 19.2% |
| Tohono O'odham | 0.0 /100 | #341 | Tragic 19.3% |
| Houma | 0.0 /100 | #342 | Tragic 19.3% |
| Immigrants | Zaire | 0.0 /100 | #343 | Tragic 19.4% |
| Immigrants | Congo | 0.0 /100 | #344 | Tragic 19.7% |
| Somalis | 0.0 /100 | #345 | Tragic 19.8% |
| Immigrants | Cabo Verde | 0.0 /100 | #346 | Tragic 19.9% |
| Immigrants | Somalia | 0.0 /100 | #347 | Tragic 20.0% |