Tohono O'odham vs Immigrants from Cameroon 6th Grade
COMPARE
Tohono O'odham
Immigrants from Cameroon
6th Grade
6th Grade Comparison
Tohono O'odham
Immigrants from Cameroon
96.5%
6TH GRADE
1.0/ 100
METRIC RATING
248th/ 347
METRIC RANK
96.3%
6TH GRADE
0.1/ 100
METRIC RATING
273rd/ 347
METRIC RANK
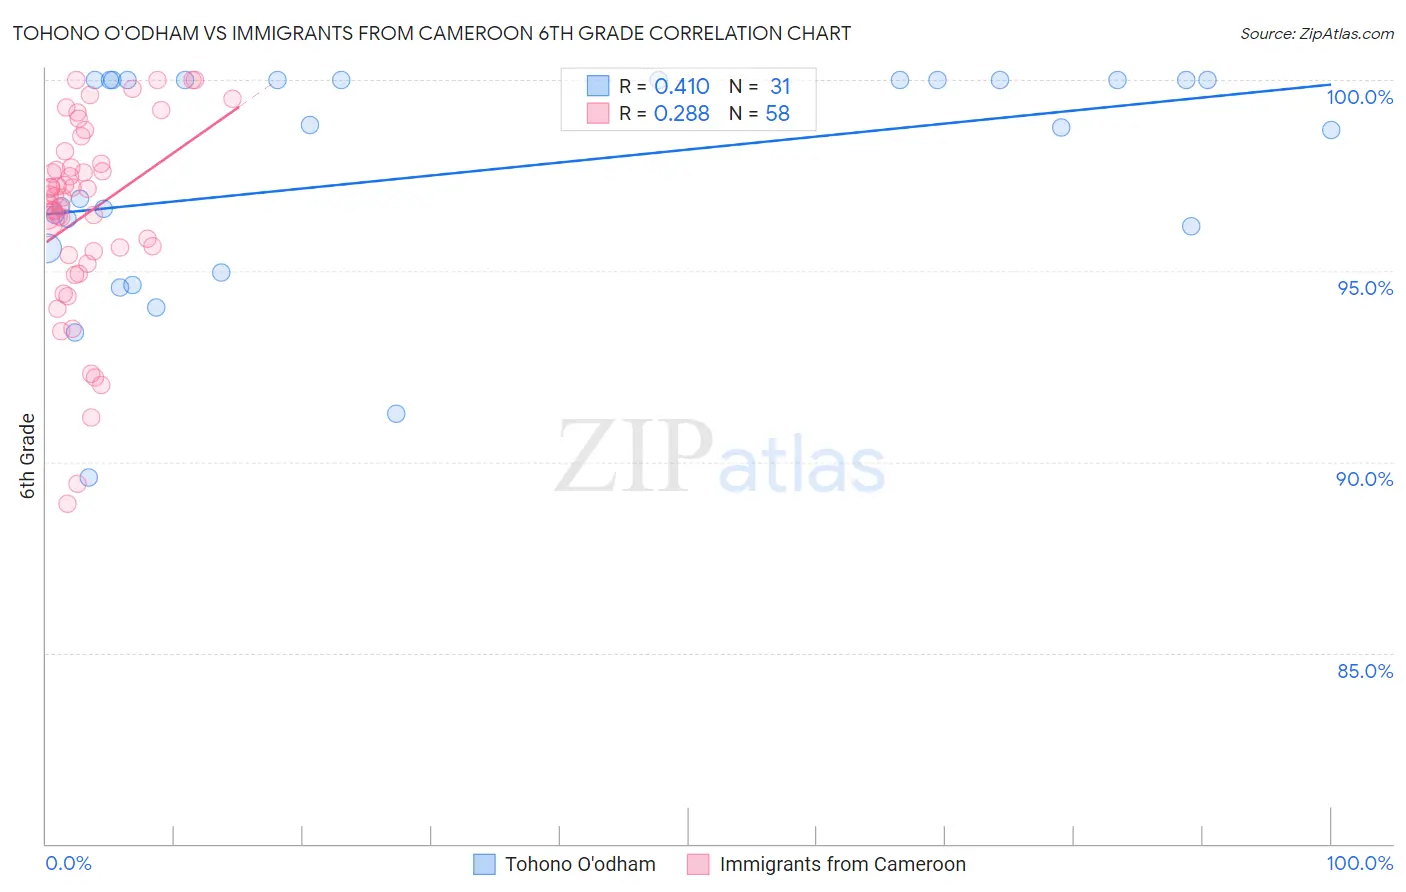
Tohono O'odham vs Immigrants from Cameroon 6th Grade Correlation Chart
The statistical analysis conducted on geographies consisting of 58,730,615 people shows a moderate positive correlation between the proportion of Tohono O'odham and percentage of population with at least 6th grade education in the United States with a correlation coefficient (R) of 0.410 and weighted average of 96.5%. Similarly, the statistical analysis conducted on geographies consisting of 130,752,798 people shows a weak positive correlation between the proportion of Immigrants from Cameroon and percentage of population with at least 6th grade education in the United States with a correlation coefficient (R) of 0.288 and weighted average of 96.3%, a difference of 0.25%.
6th Grade Correlation Summary
| Measurement | Tohono O'odham | Immigrants from Cameroon |
| Minimum | 89.6% | 88.9% |
| Maximum | 100.0% | 100.0% |
| Range | 10.4% | 11.1% |
| Mean | 97.5% | 96.5% |
| Median | 98.8% | 96.9% |
| Interquartile 25% (IQ1) | 95.6% | 95.4% |
| Interquartile 75% (IQ3) | 100.0% | 97.8% |
| Interquartile Range (IQR) | 4.4% | 2.4% |
| Standard Deviation (Sample) | 2.9% | 2.5% |
| Standard Deviation (Population) | 2.9% | 2.5% |
Similar Demographics by 6th Grade
Demographics Similar to Tohono O'odham by 6th Grade
In terms of 6th grade, the demographic groups most similar to Tohono O'odham are Bolivian (96.5%, a difference of 0.0%), Colombian (96.5%, a difference of 0.0%), Immigrants from Middle Africa (96.5%, a difference of 0.020%), Immigrants from Costa Rica (96.6%, a difference of 0.040%), and Immigrants from Africa (96.6%, a difference of 0.040%).
| Demographics | Rating | Rank | 6th Grade |
| Senegalese | 1.8 /100 | #241 | Tragic 96.6% |
| Immigrants | Asia | 1.8 /100 | #242 | Tragic 96.6% |
| Immigrants | Liberia | 1.6 /100 | #243 | Tragic 96.6% |
| Ethiopians | 1.5 /100 | #244 | Tragic 96.6% |
| Immigrants | Costa Rica | 1.3 /100 | #245 | Tragic 96.6% |
| Immigrants | Africa | 1.3 /100 | #246 | Tragic 96.6% |
| Bolivians | 1.0 /100 | #247 | Tragic 96.5% |
| Tohono O'odham | 1.0 /100 | #248 | Tragic 96.5% |
| Colombians | 0.9 /100 | #249 | Tragic 96.5% |
| Immigrants | Middle Africa | 0.8 /100 | #250 | Tragic 96.5% |
| Immigrants | Senegal | 0.7 /100 | #251 | Tragic 96.5% |
| Immigrants | Uruguay | 0.6 /100 | #252 | Tragic 96.5% |
| Jamaicans | 0.6 /100 | #253 | Tragic 96.5% |
| Immigrants | Ethiopia | 0.6 /100 | #254 | Tragic 96.5% |
| Immigrants | Congo | 0.6 /100 | #255 | Tragic 96.5% |
Demographics Similar to Immigrants from Cameroon by 6th Grade
In terms of 6th grade, the demographic groups most similar to Immigrants from Cameroon are Immigrants from Philippines (96.3%, a difference of 0.0%), Immigrants from Bolivia (96.3%, a difference of 0.010%), Immigrants from Ghana (96.3%, a difference of 0.010%), Yaqui (96.3%, a difference of 0.020%), and Immigrants from Western Africa (96.3%, a difference of 0.030%).
| Demographics | Rating | Rank | 6th Grade |
| Ghanaians | 0.2 /100 | #266 | Tragic 96.4% |
| Afghans | 0.2 /100 | #267 | Tragic 96.4% |
| Immigrants | Uzbekistan | 0.2 /100 | #268 | Tragic 96.3% |
| West Indians | 0.2 /100 | #269 | Tragic 96.3% |
| Immigrants | South America | 0.2 /100 | #270 | Tragic 96.3% |
| Immigrants | Hong Kong | 0.2 /100 | #271 | Tragic 96.3% |
| Immigrants | Bolivia | 0.1 /100 | #272 | Tragic 96.3% |
| Immigrants | Cameroon | 0.1 /100 | #273 | Tragic 96.3% |
| Immigrants | Philippines | 0.1 /100 | #274 | Tragic 96.3% |
| Immigrants | Ghana | 0.1 /100 | #275 | Tragic 96.3% |
| Yaqui | 0.1 /100 | #276 | Tragic 96.3% |
| Immigrants | Western Africa | 0.1 /100 | #277 | Tragic 96.3% |
| Immigrants | Thailand | 0.1 /100 | #278 | Tragic 96.3% |
| Immigrants | Peru | 0.1 /100 | #279 | Tragic 96.2% |
| Immigrants | Afghanistan | 0.1 /100 | #280 | Tragic 96.2% |