Tohono O'odham vs Austrian 6th Grade
COMPARE
Tohono O'odham
Austrian
6th Grade
6th Grade Comparison
Tohono O'odham
Austrians
96.5%
6TH GRADE
1.0/ 100
METRIC RATING
248th/ 347
METRIC RANK
97.7%
6TH GRADE
99.8/ 100
METRIC RATING
56th/ 347
METRIC RANK
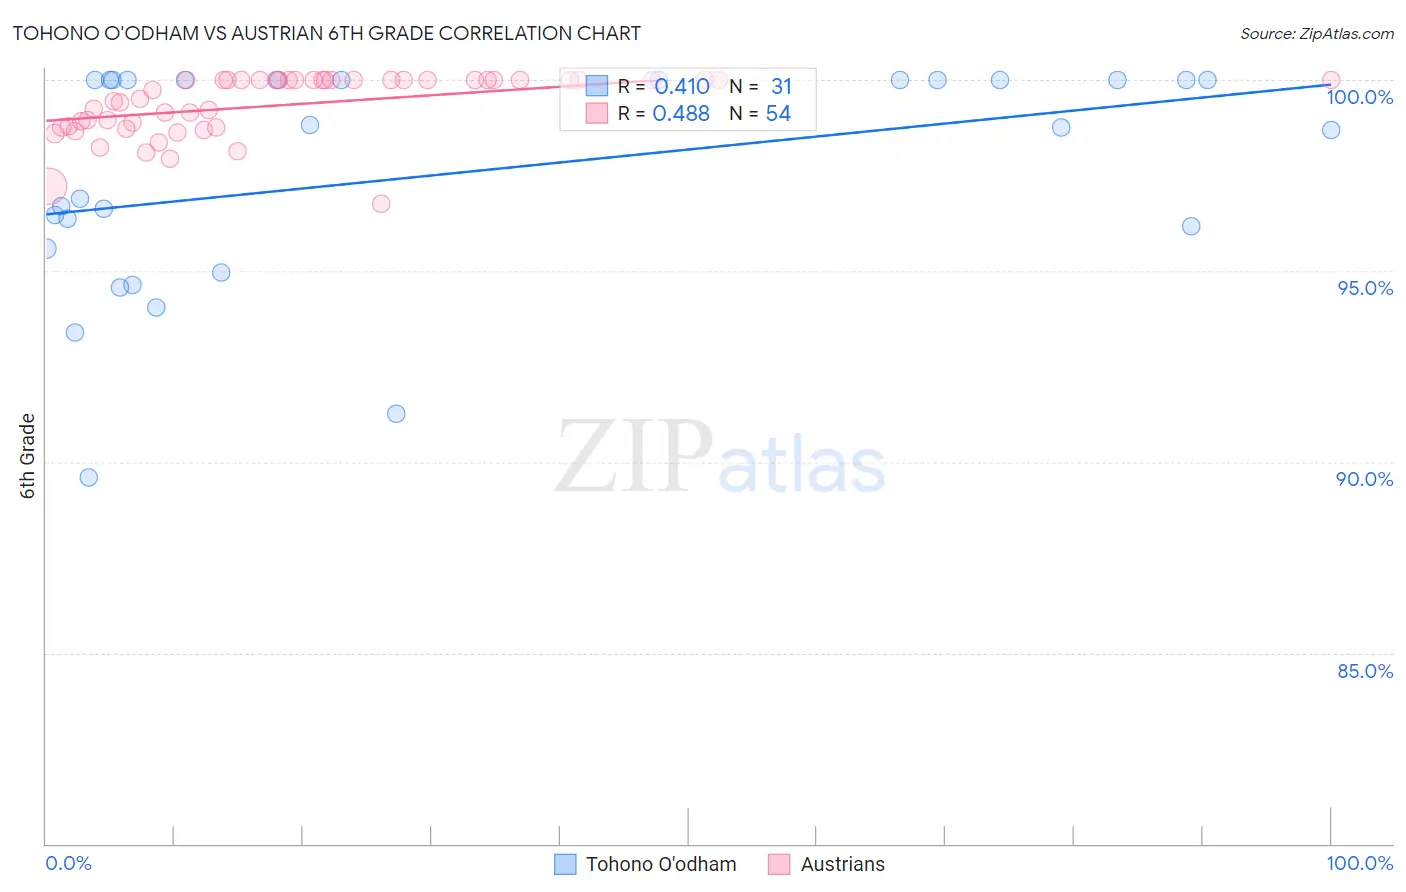
Tohono O'odham vs Austrian 6th Grade Correlation Chart
The statistical analysis conducted on geographies consisting of 58,730,615 people shows a moderate positive correlation between the proportion of Tohono O'odham and percentage of population with at least 6th grade education in the United States with a correlation coefficient (R) of 0.410 and weighted average of 96.5%. Similarly, the statistical analysis conducted on geographies consisting of 452,080,536 people shows a moderate positive correlation between the proportion of Austrians and percentage of population with at least 6th grade education in the United States with a correlation coefficient (R) of 0.488 and weighted average of 97.7%, a difference of 1.3%.
6th Grade Correlation Summary
| Measurement | Tohono O'odham | Austrian |
| Minimum | 89.6% | 96.8% |
| Maximum | 100.0% | 100.0% |
| Range | 10.4% | 3.2% |
| Mean | 97.5% | 99.4% |
| Median | 98.8% | 99.9% |
| Interquartile 25% (IQ1) | 95.6% | 98.8% |
| Interquartile 75% (IQ3) | 100.0% | 100.0% |
| Interquartile Range (IQR) | 4.4% | 1.2% |
| Standard Deviation (Sample) | 2.9% | 0.80% |
| Standard Deviation (Population) | 2.9% | 0.80% |
Similar Demographics by 6th Grade
Demographics Similar to Tohono O'odham by 6th Grade
In terms of 6th grade, the demographic groups most similar to Tohono O'odham are Bolivian (96.5%, a difference of 0.0%), Colombian (96.5%, a difference of 0.0%), Immigrants from Middle Africa (96.5%, a difference of 0.020%), Immigrants from Costa Rica (96.6%, a difference of 0.040%), and Immigrants from Africa (96.6%, a difference of 0.040%).
| Demographics | Rating | Rank | 6th Grade |
| Senegalese | 1.8 /100 | #241 | Tragic 96.6% |
| Immigrants | Asia | 1.8 /100 | #242 | Tragic 96.6% |
| Immigrants | Liberia | 1.6 /100 | #243 | Tragic 96.6% |
| Ethiopians | 1.5 /100 | #244 | Tragic 96.6% |
| Immigrants | Costa Rica | 1.3 /100 | #245 | Tragic 96.6% |
| Immigrants | Africa | 1.3 /100 | #246 | Tragic 96.6% |
| Bolivians | 1.0 /100 | #247 | Tragic 96.5% |
| Tohono O'odham | 1.0 /100 | #248 | Tragic 96.5% |
| Colombians | 0.9 /100 | #249 | Tragic 96.5% |
| Immigrants | Middle Africa | 0.8 /100 | #250 | Tragic 96.5% |
| Immigrants | Senegal | 0.7 /100 | #251 | Tragic 96.5% |
| Immigrants | Uruguay | 0.6 /100 | #252 | Tragic 96.5% |
| Jamaicans | 0.6 /100 | #253 | Tragic 96.5% |
| Immigrants | Ethiopia | 0.6 /100 | #254 | Tragic 96.5% |
| Immigrants | Congo | 0.6 /100 | #255 | Tragic 96.5% |
Demographics Similar to Austrians by 6th Grade
In terms of 6th grade, the demographic groups most similar to Austrians are Creek (97.7%, a difference of 0.010%), Aleut (97.7%, a difference of 0.010%), White/Caucasian (97.7%, a difference of 0.010%), Greek (97.7%, a difference of 0.010%), and Maltese (97.8%, a difference of 0.020%).
| Demographics | Rating | Rank | 6th Grade |
| Estonians | 99.8 /100 | #49 | Exceptional 97.8% |
| Immigrants | Scotland | 99.8 /100 | #50 | Exceptional 97.8% |
| Maltese | 99.8 /100 | #51 | Exceptional 97.8% |
| Australians | 99.8 /100 | #52 | Exceptional 97.8% |
| Slavs | 99.8 /100 | #53 | Exceptional 97.8% |
| Creek | 99.8 /100 | #54 | Exceptional 97.7% |
| Aleuts | 99.8 /100 | #55 | Exceptional 97.7% |
| Austrians | 99.8 /100 | #56 | Exceptional 97.7% |
| Whites/Caucasians | 99.8 /100 | #57 | Exceptional 97.7% |
| Greeks | 99.8 /100 | #58 | Exceptional 97.7% |
| Americans | 99.8 /100 | #59 | Exceptional 97.7% |
| Immigrants | Canada | 99.8 /100 | #60 | Exceptional 97.7% |
| Serbians | 99.7 /100 | #61 | Exceptional 97.7% |
| Immigrants | North America | 99.7 /100 | #62 | Exceptional 97.7% |
| Russians | 99.7 /100 | #63 | Exceptional 97.7% |