Czech vs Immigrants from Jamaica 10th Grade
COMPARE
Czech
Immigrants from Jamaica
10th Grade
10th Grade Comparison
Czechs
Immigrants from Jamaica
95.5%
10TH GRADE
100.0/ 100
METRIC RATING
23rd/ 347
METRIC RANK
92.6%
10TH GRADE
0.5/ 100
METRIC RATING
259th/ 347
METRIC RANK
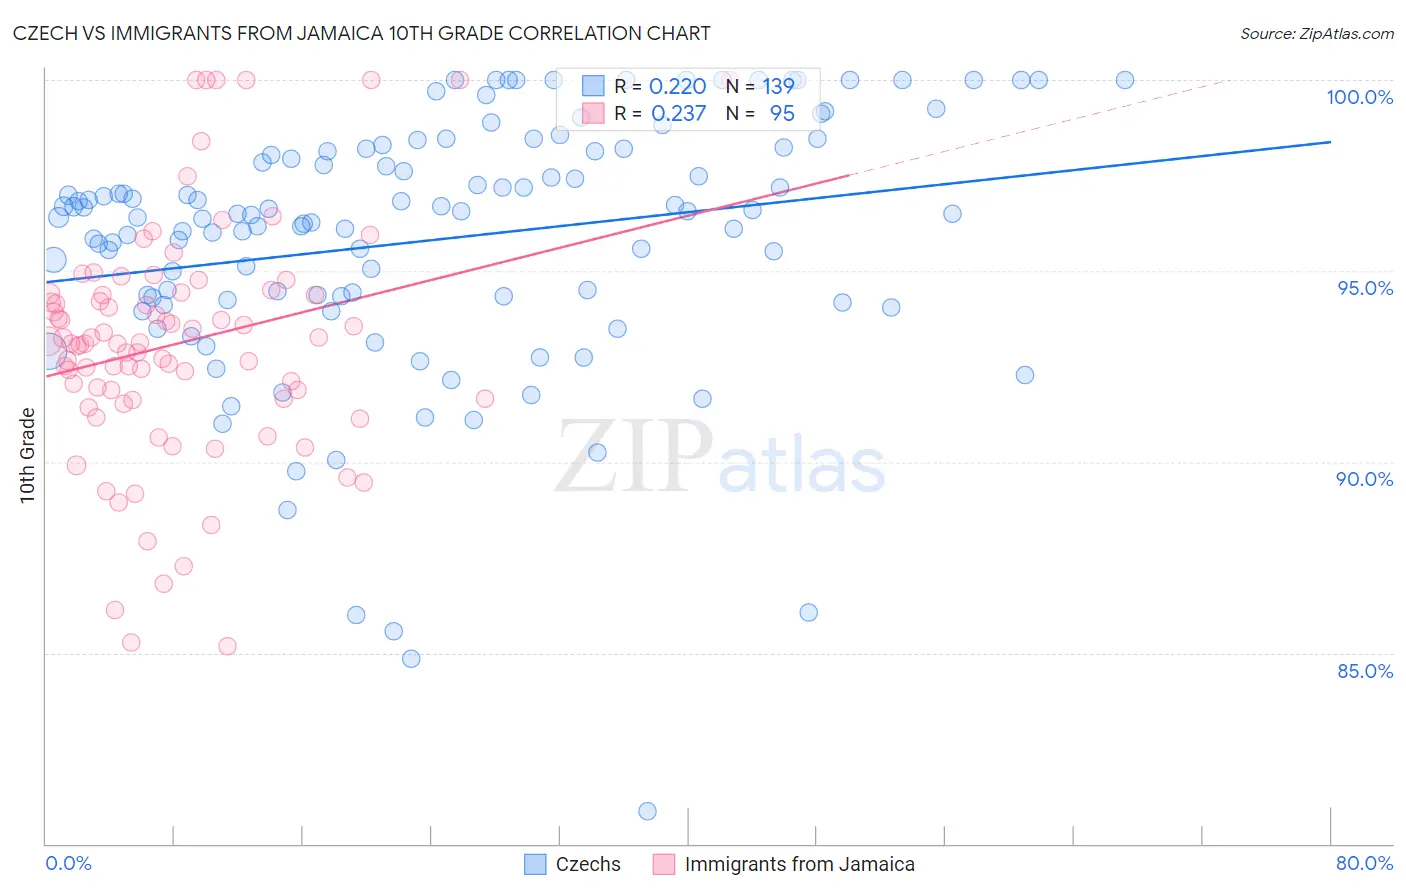
Czech vs Immigrants from Jamaica 10th Grade Correlation Chart
The statistical analysis conducted on geographies consisting of 484,813,928 people shows a weak positive correlation between the proportion of Czechs and percentage of population with at least 10th grade education in the United States with a correlation coefficient (R) of 0.220 and weighted average of 95.5%. Similarly, the statistical analysis conducted on geographies consisting of 301,829,550 people shows a weak positive correlation between the proportion of Immigrants from Jamaica and percentage of population with at least 10th grade education in the United States with a correlation coefficient (R) of 0.237 and weighted average of 92.6%, a difference of 3.1%.
10th Grade Correlation Summary
| Measurement | Czech | Immigrants from Jamaica |
| Minimum | 80.9% | 85.2% |
| Maximum | 100.0% | 100.0% |
| Range | 19.1% | 14.8% |
| Mean | 95.8% | 93.1% |
| Median | 96.5% | 93.1% |
| Interquartile 25% (IQ1) | 94.3% | 91.6% |
| Interquartile 75% (IQ3) | 98.1% | 94.4% |
| Interquartile Range (IQR) | 3.9% | 2.8% |
| Standard Deviation (Sample) | 3.4% | 3.1% |
| Standard Deviation (Population) | 3.4% | 3.1% |
Similar Demographics by 10th Grade
Demographics Similar to Czechs by 10th Grade
In terms of 10th grade, the demographic groups most similar to Czechs are Eastern European (95.5%, a difference of 0.010%), European (95.5%, a difference of 0.010%), Maltese (95.5%, a difference of 0.020%), Welsh (95.5%, a difference of 0.030%), and Dutch (95.5%, a difference of 0.050%).
| Demographics | Rating | Rank | 10th Grade |
| Scottish | 100.0 /100 | #16 | Exceptional 95.6% |
| Latvians | 100.0 /100 | #17 | Exceptional 95.6% |
| Italians | 100.0 /100 | #18 | Exceptional 95.6% |
| Scandinavians | 100.0 /100 | #19 | Exceptional 95.6% |
| Chinese | 100.0 /100 | #20 | Exceptional 95.5% |
| Dutch | 100.0 /100 | #21 | Exceptional 95.5% |
| Eastern Europeans | 100.0 /100 | #22 | Exceptional 95.5% |
| Czechs | 100.0 /100 | #23 | Exceptional 95.5% |
| Europeans | 100.0 /100 | #24 | Exceptional 95.5% |
| Maltese | 100.0 /100 | #25 | Exceptional 95.5% |
| Welsh | 100.0 /100 | #26 | Exceptional 95.5% |
| Alaskan Athabascans | 100.0 /100 | #27 | Exceptional 95.4% |
| Luxembourgers | 100.0 /100 | #28 | Exceptional 95.4% |
| Bulgarians | 100.0 /100 | #29 | Exceptional 95.4% |
| Belgians | 100.0 /100 | #30 | Exceptional 95.4% |
Demographics Similar to Immigrants from Jamaica by 10th Grade
In terms of 10th grade, the demographic groups most similar to Immigrants from Jamaica are Immigrants from Uzbekistan (92.6%, a difference of 0.010%), U.S. Virgin Islander (92.7%, a difference of 0.040%), Immigrants from Costa Rica (92.7%, a difference of 0.040%), Paiute (92.6%, a difference of 0.050%), and Immigrants from Bolivia (92.7%, a difference of 0.060%).
| Demographics | Rating | Rank | 10th Grade |
| South Americans | 0.9 /100 | #252 | Tragic 92.8% |
| Ghanaians | 0.9 /100 | #253 | Tragic 92.8% |
| Armenians | 0.9 /100 | #254 | Tragic 92.7% |
| Immigrants | Bolivia | 0.7 /100 | #255 | Tragic 92.7% |
| Immigrants | Nigeria | 0.7 /100 | #256 | Tragic 92.7% |
| U.S. Virgin Islanders | 0.7 /100 | #257 | Tragic 92.7% |
| Immigrants | Costa Rica | 0.6 /100 | #258 | Tragic 92.7% |
| Immigrants | Jamaica | 0.5 /100 | #259 | Tragic 92.6% |
| Immigrants | Uzbekistan | 0.5 /100 | #260 | Tragic 92.6% |
| Paiute | 0.4 /100 | #261 | Tragic 92.6% |
| Immigrants | South America | 0.4 /100 | #262 | Tragic 92.6% |
| Apache | 0.4 /100 | #263 | Tragic 92.6% |
| Peruvians | 0.4 /100 | #264 | Tragic 92.6% |
| Dutch West Indians | 0.4 /100 | #265 | Tragic 92.6% |
| Immigrants | Philippines | 0.4 /100 | #266 | Tragic 92.6% |