Colville vs Immigrants from Jamaica 10th Grade
COMPARE
Colville
Immigrants from Jamaica
10th Grade
10th Grade Comparison
Colville
Immigrants from Jamaica
93.6%
10TH GRADE
38.8/ 100
METRIC RATING
182nd/ 347
METRIC RANK
92.6%
10TH GRADE
0.5/ 100
METRIC RATING
259th/ 347
METRIC RANK
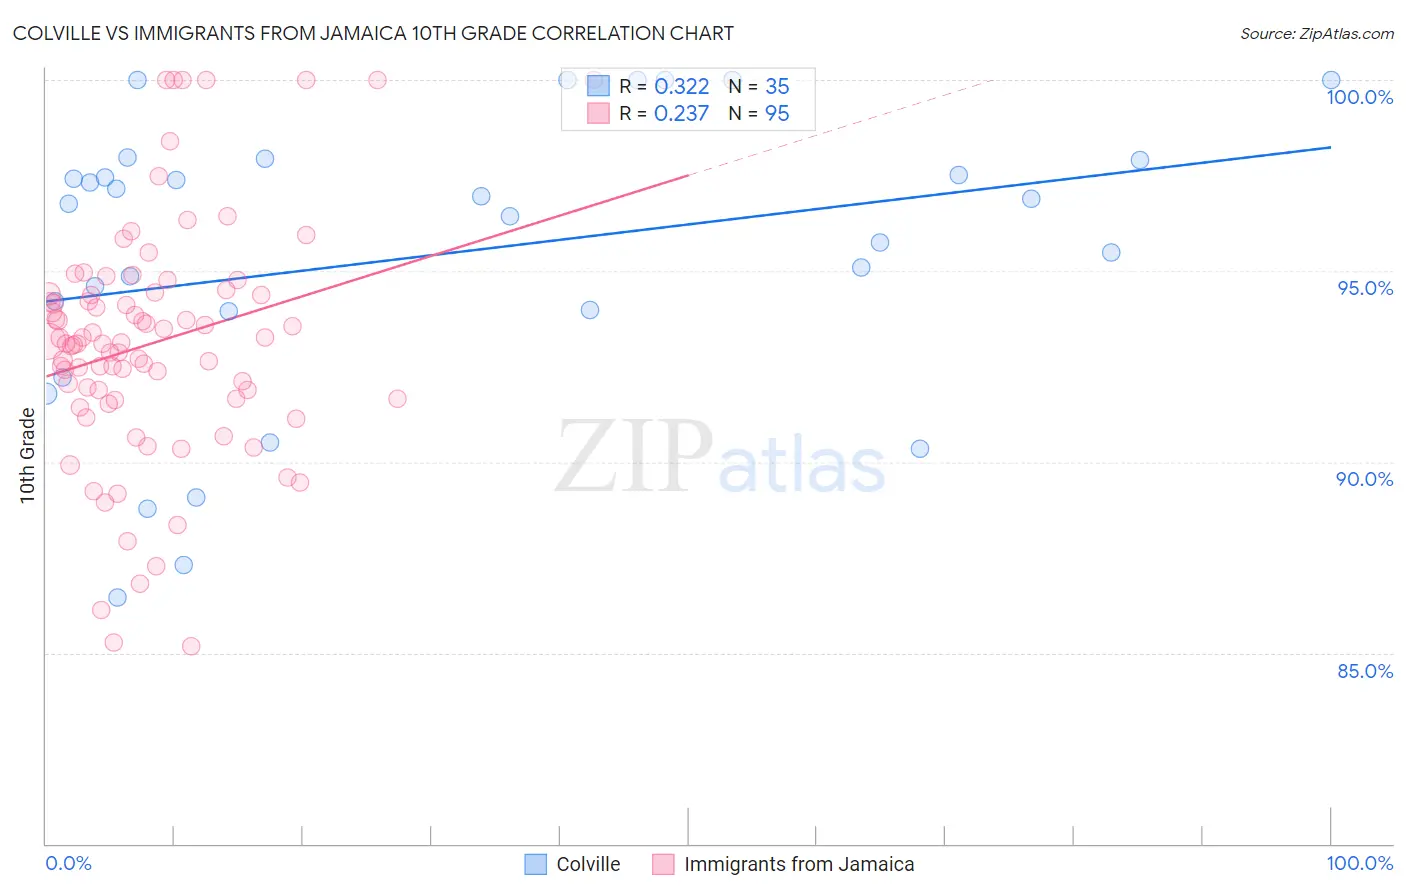
Colville vs Immigrants from Jamaica 10th Grade Correlation Chart
The statistical analysis conducted on geographies consisting of 34,682,094 people shows a mild positive correlation between the proportion of Colville and percentage of population with at least 10th grade education in the United States with a correlation coefficient (R) of 0.322 and weighted average of 93.6%. Similarly, the statistical analysis conducted on geographies consisting of 301,829,550 people shows a weak positive correlation between the proportion of Immigrants from Jamaica and percentage of population with at least 10th grade education in the United States with a correlation coefficient (R) of 0.237 and weighted average of 92.6%, a difference of 1.1%.
10th Grade Correlation Summary
| Measurement | Colville | Immigrants from Jamaica |
| Minimum | 86.4% | 85.2% |
| Maximum | 100.0% | 100.0% |
| Range | 13.6% | 14.8% |
| Mean | 95.4% | 93.1% |
| Median | 96.8% | 93.1% |
| Interquartile 25% (IQ1) | 93.9% | 91.6% |
| Interquartile 75% (IQ3) | 97.9% | 94.4% |
| Interquartile Range (IQR) | 4.0% | 2.8% |
| Standard Deviation (Sample) | 3.8% | 3.1% |
| Standard Deviation (Population) | 3.7% | 3.1% |
Similar Demographics by 10th Grade
Demographics Similar to Colville by 10th Grade
In terms of 10th grade, the demographic groups most similar to Colville are Guamanian/Chamorro (93.6%, a difference of 0.020%), Choctaw (93.6%, a difference of 0.020%), Sudanese (93.6%, a difference of 0.020%), Immigrants from Northern Africa (93.7%, a difference of 0.030%), and Blackfeet (93.7%, a difference of 0.040%).
| Demographics | Rating | Rank | 10th Grade |
| Immigrants | Nepal | 49.6 /100 | #175 | Average 93.7% |
| Immigrants | Argentina | 47.1 /100 | #176 | Average 93.7% |
| Immigrants | Lebanon | 47.1 /100 | #177 | Average 93.7% |
| Sierra Leoneans | 46.1 /100 | #178 | Average 93.7% |
| Paraguayans | 45.3 /100 | #179 | Average 93.7% |
| Blackfeet | 42.8 /100 | #180 | Average 93.7% |
| Immigrants | Northern Africa | 41.6 /100 | #181 | Average 93.7% |
| Colville | 38.8 /100 | #182 | Fair 93.6% |
| Guamanians/Chamorros | 37.1 /100 | #183 | Fair 93.6% |
| Choctaw | 36.6 /100 | #184 | Fair 93.6% |
| Sudanese | 36.6 /100 | #185 | Fair 93.6% |
| Immigrants | Eastern Asia | 35.1 /100 | #186 | Fair 93.6% |
| Liberians | 34.7 /100 | #187 | Fair 93.6% |
| Marshallese | 33.2 /100 | #188 | Fair 93.6% |
| Immigrants | Pakistan | 32.5 /100 | #189 | Fair 93.6% |
Demographics Similar to Immigrants from Jamaica by 10th Grade
In terms of 10th grade, the demographic groups most similar to Immigrants from Jamaica are Immigrants from Uzbekistan (92.6%, a difference of 0.010%), U.S. Virgin Islander (92.7%, a difference of 0.040%), Immigrants from Costa Rica (92.7%, a difference of 0.040%), Paiute (92.6%, a difference of 0.050%), and Immigrants from Bolivia (92.7%, a difference of 0.060%).
| Demographics | Rating | Rank | 10th Grade |
| South Americans | 0.9 /100 | #252 | Tragic 92.8% |
| Ghanaians | 0.9 /100 | #253 | Tragic 92.8% |
| Armenians | 0.9 /100 | #254 | Tragic 92.7% |
| Immigrants | Bolivia | 0.7 /100 | #255 | Tragic 92.7% |
| Immigrants | Nigeria | 0.7 /100 | #256 | Tragic 92.7% |
| U.S. Virgin Islanders | 0.7 /100 | #257 | Tragic 92.7% |
| Immigrants | Costa Rica | 0.6 /100 | #258 | Tragic 92.7% |
| Immigrants | Jamaica | 0.5 /100 | #259 | Tragic 92.6% |
| Immigrants | Uzbekistan | 0.5 /100 | #260 | Tragic 92.6% |
| Paiute | 0.4 /100 | #261 | Tragic 92.6% |
| Immigrants | South America | 0.4 /100 | #262 | Tragic 92.6% |
| Apache | 0.4 /100 | #263 | Tragic 92.6% |
| Peruvians | 0.4 /100 | #264 | Tragic 92.6% |
| Dutch West Indians | 0.4 /100 | #265 | Tragic 92.6% |
| Immigrants | Philippines | 0.4 /100 | #266 | Tragic 92.6% |