Tohono O'odham vs Cuban Householder Income Ages 45 - 64 years
COMPARE
Tohono O'odham
Cuban
Householder Income Ages 45 - 64 years
Householder Income Ages 45 - 64 years Comparison
Tohono O'odham
Cubans
$73,774
HOUSEHOLDER INCOME AGES 45 - 64 YEARS
0.0/ 100
METRIC RATING
342nd/ 347
METRIC RANK
$86,301
HOUSEHOLDER INCOME AGES 45 - 64 YEARS
0.1/ 100
METRIC RATING
289th/ 347
METRIC RANK
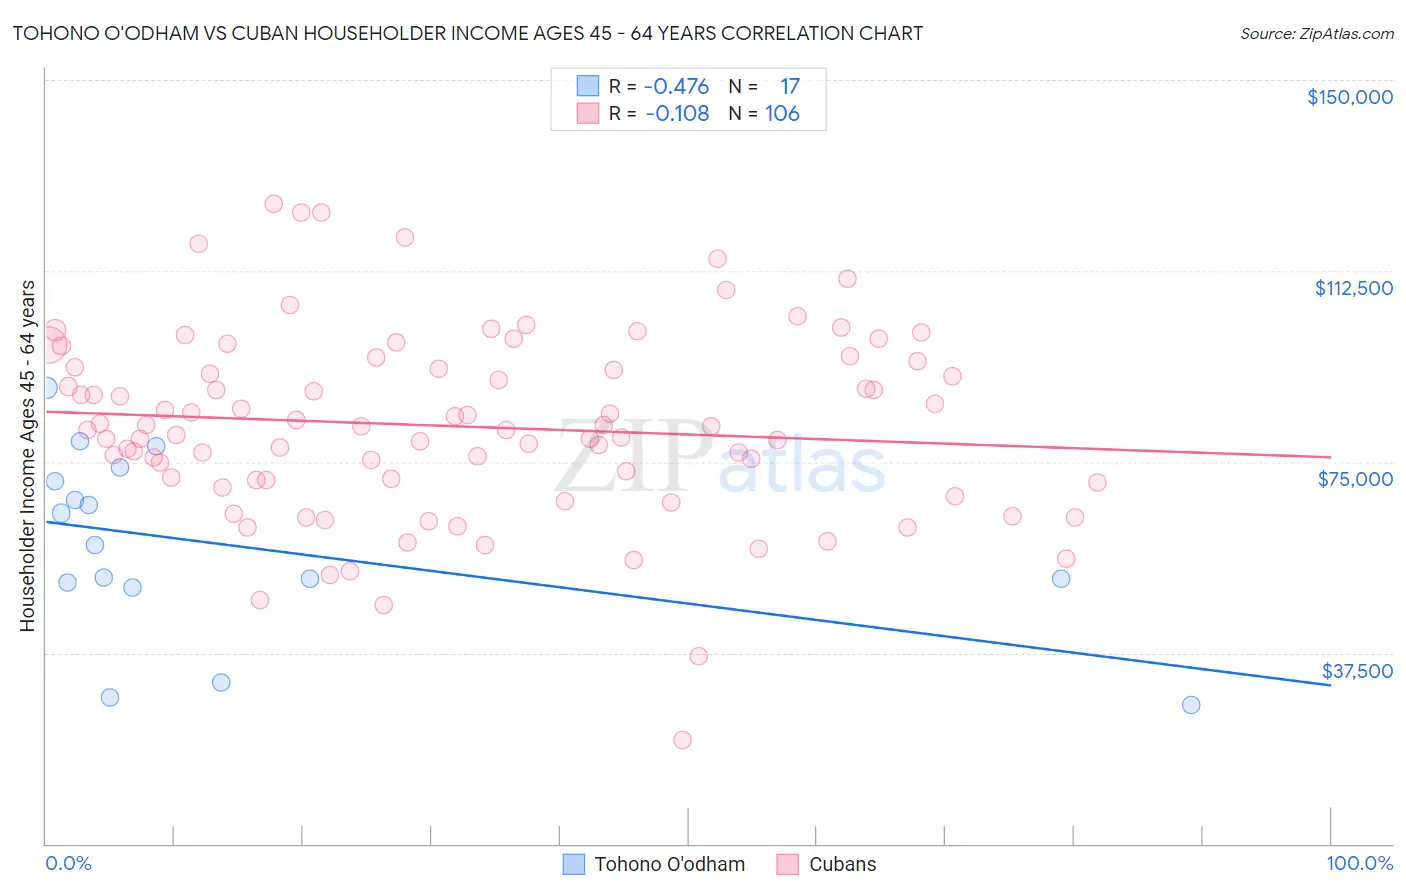
Tohono O'odham vs Cuban Householder Income Ages 45 - 64 years Correlation Chart
The statistical analysis conducted on geographies consisting of 58,700,598 people shows a moderate negative correlation between the proportion of Tohono O'odham and household income with householder between the ages 45 and 64 in the United States with a correlation coefficient (R) of -0.476 and weighted average of $73,774. Similarly, the statistical analysis conducted on geographies consisting of 448,142,263 people shows a poor negative correlation between the proportion of Cubans and household income with householder between the ages 45 and 64 in the United States with a correlation coefficient (R) of -0.108 and weighted average of $86,301, a difference of 17.0%.
Householder Income Ages 45 - 64 years Correlation Summary
| Measurement | Tohono O'odham | Cuban |
| Minimum | $27,250 | $20,329 |
| Maximum | $89,534 | $125,619 |
| Range | $62,284 | $105,290 |
| Mean | $58,522 | $81,965 |
| Median | $58,558 | $81,610 |
| Interquartile 25% (IQ1) | $50,712 | $71,341 |
| Interquartile 75% (IQ3) | $72,531 | $93,648 |
| Interquartile Range (IQR) | $21,819 | $22,307 |
| Standard Deviation (Sample) | $18,007 | $18,497 |
| Standard Deviation (Population) | $17,469 | $18,410 |
Similar Demographics by Householder Income Ages 45 - 64 years
Demographics Similar to Tohono O'odham by Householder Income Ages 45 - 64 years
In terms of householder income ages 45 - 64 years, the demographic groups most similar to Tohono O'odham are Pima ($73,365, a difference of 0.56%), Crow ($74,257, a difference of 0.65%), Immigrants from Yemen ($74,575, a difference of 1.1%), Kiowa ($74,815, a difference of 1.4%), and Houma ($72,093, a difference of 2.3%).
| Demographics | Rating | Rank | Householder Income Ages 45 - 64 years |
| Immigrants | Congo | 0.0 /100 | #333 | Tragic $77,850 |
| Menominee | 0.0 /100 | #334 | Tragic $76,903 |
| Cheyenne | 0.0 /100 | #335 | Tragic $76,362 |
| Arapaho | 0.0 /100 | #336 | Tragic $75,945 |
| Pueblo | 0.0 /100 | #337 | Tragic $75,601 |
| Hopi | 0.0 /100 | #338 | Tragic $75,562 |
| Kiowa | 0.0 /100 | #339 | Tragic $74,815 |
| Immigrants | Yemen | 0.0 /100 | #340 | Tragic $74,575 |
| Crow | 0.0 /100 | #341 | Tragic $74,257 |
| Tohono O'odham | 0.0 /100 | #342 | Tragic $73,774 |
| Pima | 0.0 /100 | #343 | Tragic $73,365 |
| Houma | 0.0 /100 | #344 | Tragic $72,093 |
| Navajo | 0.0 /100 | #345 | Tragic $69,759 |
| Puerto Ricans | 0.0 /100 | #346 | Tragic $69,234 |
| Lumbee | 0.0 /100 | #347 | Tragic $65,113 |
Demographics Similar to Cubans by Householder Income Ages 45 - 64 years
In terms of householder income ages 45 - 64 years, the demographic groups most similar to Cubans are Immigrants from St. Vincent and the Grenadines ($86,394, a difference of 0.11%), Bangladeshi ($86,402, a difference of 0.12%), Cherokee ($86,125, a difference of 0.20%), Immigrants from Guatemala ($86,573, a difference of 0.32%), and Blackfeet ($86,595, a difference of 0.34%).
| Demographics | Rating | Rank | Householder Income Ages 45 - 64 years |
| Senegalese | 0.1 /100 | #282 | Tragic $86,897 |
| Mexicans | 0.1 /100 | #283 | Tragic $86,816 |
| Central American Indians | 0.1 /100 | #284 | Tragic $86,764 |
| Blackfeet | 0.1 /100 | #285 | Tragic $86,595 |
| Immigrants | Guatemala | 0.1 /100 | #286 | Tragic $86,573 |
| Bangladeshis | 0.1 /100 | #287 | Tragic $86,402 |
| Immigrants | St. Vincent and the Grenadines | 0.1 /100 | #288 | Tragic $86,394 |
| Cubans | 0.1 /100 | #289 | Tragic $86,301 |
| Cherokee | 0.1 /100 | #290 | Tragic $86,125 |
| Hispanics or Latinos | 0.1 /100 | #291 | Tragic $86,006 |
| Immigrants | Central America | 0.1 /100 | #292 | Tragic $85,965 |
| Comanche | 0.1 /100 | #293 | Tragic $85,787 |
| British West Indians | 0.1 /100 | #294 | Tragic $85,571 |
| Immigrants | Grenada | 0.1 /100 | #295 | Tragic $85,552 |
| Immigrants | Zaire | 0.1 /100 | #296 | Tragic $85,207 |