Cree vs Cuban 4th Grade
COMPARE
Cree
Cuban
4th Grade
4th Grade Comparison
Cree
Cubans
97.9%
4TH GRADE
98.1/ 100
METRIC RATING
101st/ 347
METRIC RANK
96.9%
4TH GRADE
0.2/ 100
METRIC RATING
270th/ 347
METRIC RANK
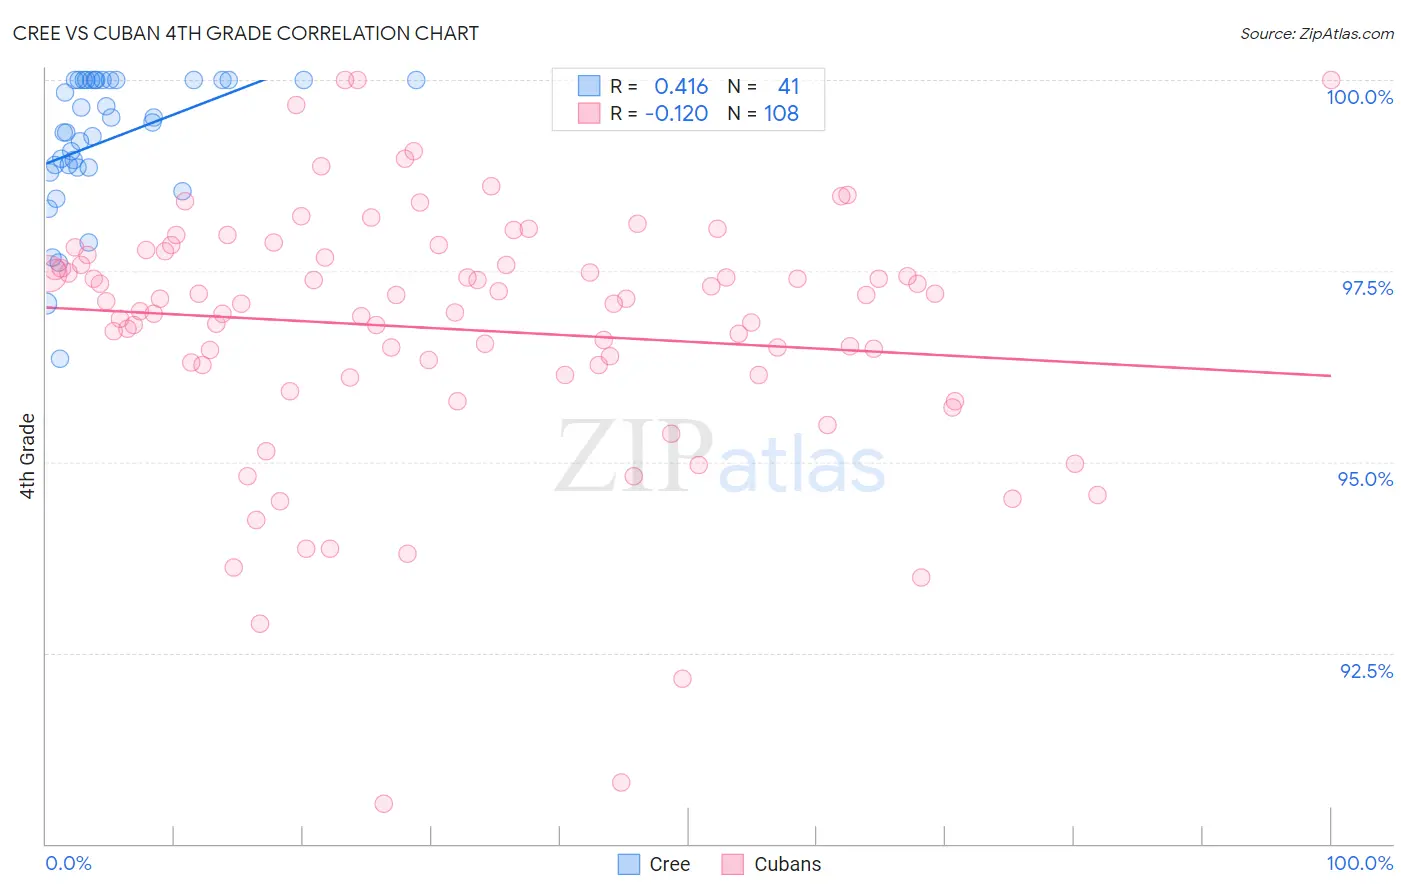
Cree vs Cuban 4th Grade Correlation Chart
The statistical analysis conducted on geographies consisting of 76,211,744 people shows a moderate positive correlation between the proportion of Cree and percentage of population with at least 4th grade education in the United States with a correlation coefficient (R) of 0.416 and weighted average of 97.9%. Similarly, the statistical analysis conducted on geographies consisting of 449,326,865 people shows a poor negative correlation between the proportion of Cubans and percentage of population with at least 4th grade education in the United States with a correlation coefficient (R) of -0.120 and weighted average of 96.9%, a difference of 0.99%.
4th Grade Correlation Summary
| Measurement | Cree | Cuban |
| Minimum | 96.4% | 90.5% |
| Maximum | 100.0% | 100.0% |
| Range | 3.6% | 9.5% |
| Mean | 99.2% | 96.7% |
| Median | 99.4% | 97.1% |
| Interquartile 25% (IQ1) | 98.9% | 96.2% |
| Interquartile 75% (IQ3) | 100.0% | 97.7% |
| Interquartile Range (IQR) | 1.1% | 1.5% |
| Standard Deviation (Sample) | 0.90% | 1.7% |
| Standard Deviation (Population) | 0.89% | 1.7% |
Similar Demographics by 4th Grade
Demographics Similar to Cree by 4th Grade
In terms of 4th grade, the demographic groups most similar to Cree are Yugoslavian (97.9%, a difference of 0.0%), South African (97.9%, a difference of 0.010%), Turkish (97.9%, a difference of 0.010%), Choctaw (97.9%, a difference of 0.010%), and Immigrants from Germany (97.9%, a difference of 0.020%).
| Demographics | Rating | Rank | 4th Grade |
| Shoshone | 98.7 /100 | #94 | Exceptional 97.9% |
| Immigrants | Germany | 98.5 /100 | #95 | Exceptional 97.9% |
| Romanians | 98.4 /100 | #96 | Exceptional 97.9% |
| Cheyenne | 98.4 /100 | #97 | Exceptional 97.9% |
| South Africans | 98.2 /100 | #98 | Exceptional 97.9% |
| Turks | 98.2 /100 | #99 | Exceptional 97.9% |
| Yugoslavians | 98.1 /100 | #100 | Exceptional 97.9% |
| Cree | 98.1 /100 | #101 | Exceptional 97.9% |
| Choctaw | 97.9 /100 | #102 | Exceptional 97.9% |
| Puget Sound Salish | 97.7 /100 | #103 | Exceptional 97.9% |
| Immigrants | Nonimmigrants | 97.5 /100 | #104 | Exceptional 97.9% |
| German Russians | 97.5 /100 | #105 | Exceptional 97.9% |
| Immigrants | Czechoslovakia | 97.5 /100 | #106 | Exceptional 97.9% |
| Bhutanese | 97.4 /100 | #107 | Exceptional 97.9% |
| Immigrants | Singapore | 97.3 /100 | #108 | Exceptional 97.9% |
Demographics Similar to Cubans by 4th Grade
In terms of 4th grade, the demographic groups most similar to Cubans are Immigrants from Peru (96.9%, a difference of 0.010%), Fijian (96.9%, a difference of 0.010%), Immigrants from Uzbekistan (96.9%, a difference of 0.020%), Immigrants from Cameroon (96.9%, a difference of 0.020%), and Trinidadian and Tobagonian (96.9%, a difference of 0.030%).
| Demographics | Rating | Rank | 4th Grade |
| Immigrants | Jamaica | 0.3 /100 | #263 | Tragic 97.0% |
| Taiwanese | 0.3 /100 | #264 | Tragic 97.0% |
| Armenians | 0.3 /100 | #265 | Tragic 97.0% |
| Immigrants | China | 0.3 /100 | #266 | Tragic 97.0% |
| Immigrants | Nigeria | 0.3 /100 | #267 | Tragic 97.0% |
| Ghanaians | 0.2 /100 | #268 | Tragic 97.0% |
| Immigrants | Uzbekistan | 0.2 /100 | #269 | Tragic 96.9% |
| Cubans | 0.2 /100 | #270 | Tragic 96.9% |
| Immigrants | Peru | 0.1 /100 | #271 | Tragic 96.9% |
| Fijians | 0.1 /100 | #272 | Tragic 96.9% |
| Immigrants | Cameroon | 0.1 /100 | #273 | Tragic 96.9% |
| Trinidadians and Tobagonians | 0.1 /100 | #274 | Tragic 96.9% |
| Immigrants | Ghana | 0.1 /100 | #275 | Tragic 96.9% |
| Yaqui | 0.1 /100 | #276 | Tragic 96.9% |
| Immigrants | Western Africa | 0.1 /100 | #277 | Tragic 96.9% |