Pakistani vs Latvian 8th Grade
COMPARE
Pakistani
Latvian
8th Grade
8th Grade Comparison
Pakistanis
Latvians
95.7%
8TH GRADE
48.8/ 100
METRIC RATING
176th/ 347
METRIC RANK
97.0%
8TH GRADE
100.0/ 100
METRIC RATING
37th/ 347
METRIC RANK
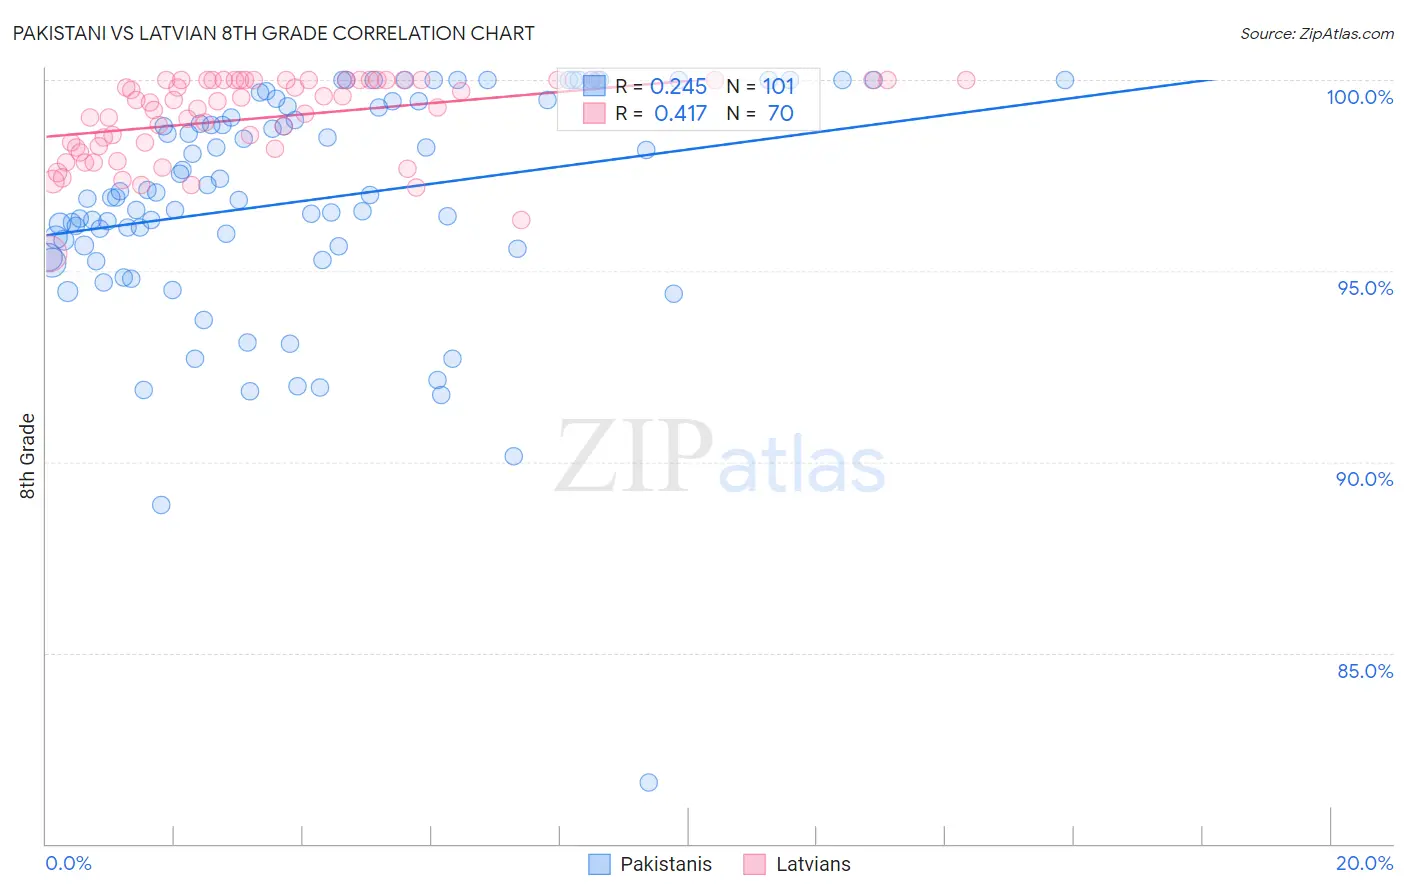
Pakistani vs Latvian 8th Grade Correlation Chart
The statistical analysis conducted on geographies consisting of 335,355,370 people shows a weak positive correlation between the proportion of Pakistanis and percentage of population with at least 8th grade education in the United States with a correlation coefficient (R) of 0.245 and weighted average of 95.7%. Similarly, the statistical analysis conducted on geographies consisting of 220,726,452 people shows a moderate positive correlation between the proportion of Latvians and percentage of population with at least 8th grade education in the United States with a correlation coefficient (R) of 0.417 and weighted average of 97.0%, a difference of 1.3%.
8th Grade Correlation Summary
| Measurement | Pakistani | Latvian |
| Minimum | 81.6% | 95.4% |
| Maximum | 100.0% | 100.0% |
| Range | 18.4% | 4.6% |
| Mean | 96.8% | 99.0% |
| Median | 97.0% | 99.4% |
| Interquartile 25% (IQ1) | 95.6% | 98.2% |
| Interquartile 75% (IQ3) | 99.4% | 100.0% |
| Interquartile Range (IQR) | 3.8% | 1.8% |
| Standard Deviation (Sample) | 3.0% | 1.1% |
| Standard Deviation (Population) | 3.0% | 1.1% |
Similar Demographics by 8th Grade
Demographics Similar to Pakistanis by 8th Grade
In terms of 8th grade, the demographic groups most similar to Pakistanis are Chilean (95.7%, a difference of 0.010%), Immigrants from Albania (95.7%, a difference of 0.010%), Marshallese (95.7%, a difference of 0.010%), Venezuelan (95.7%, a difference of 0.010%), and Immigrants from Brazil (95.7%, a difference of 0.020%).
| Demographics | Rating | Rank | 8th Grade |
| Immigrants | Iran | 58.6 /100 | #169 | Average 95.8% |
| Ute | 58.5 /100 | #170 | Average 95.8% |
| Egyptians | 58.2 /100 | #171 | Average 95.8% |
| Immigrants | Korea | 57.9 /100 | #172 | Average 95.8% |
| Mongolians | 53.0 /100 | #173 | Average 95.8% |
| Chileans | 50.0 /100 | #174 | Average 95.7% |
| Immigrants | Albania | 49.6 /100 | #175 | Average 95.7% |
| Pakistanis | 48.8 /100 | #176 | Average 95.7% |
| Marshallese | 47.6 /100 | #177 | Average 95.7% |
| Venezuelans | 47.5 /100 | #178 | Average 95.7% |
| Immigrants | Brazil | 45.4 /100 | #179 | Average 95.7% |
| Iraqis | 40.5 /100 | #180 | Average 95.7% |
| Immigrants | Spain | 38.7 /100 | #181 | Fair 95.7% |
| Immigrants | Egypt | 37.9 /100 | #182 | Fair 95.7% |
| Immigrants | Iraq | 36.2 /100 | #183 | Fair 95.6% |
Demographics Similar to Latvians by 8th Grade
In terms of 8th grade, the demographic groups most similar to Latvians are Belgian (97.0%, a difference of 0.0%), Alaska Native (97.0%, a difference of 0.010%), Luxembourger (97.0%, a difference of 0.020%), British (97.0%, a difference of 0.020%), and Hungarian (97.0%, a difference of 0.020%).
| Demographics | Rating | Rank | 8th Grade |
| Sioux | 100.0 /100 | #30 | Exceptional 97.1% |
| Chippewa | 100.0 /100 | #31 | Exceptional 97.1% |
| Yup'ik | 100.0 /100 | #32 | Exceptional 97.0% |
| Swiss | 100.0 /100 | #33 | Exceptional 97.0% |
| Luxembourgers | 100.0 /100 | #34 | Exceptional 97.0% |
| Alaska Natives | 100.0 /100 | #35 | Exceptional 97.0% |
| Belgians | 100.0 /100 | #36 | Exceptional 97.0% |
| Latvians | 100.0 /100 | #37 | Exceptional 97.0% |
| British | 100.0 /100 | #38 | Exceptional 97.0% |
| Hungarians | 100.0 /100 | #39 | Exceptional 97.0% |
| Inupiat | 100.0 /100 | #40 | Exceptional 97.0% |
| Eastern Europeans | 100.0 /100 | #41 | Exceptional 97.0% |
| Chinese | 100.0 /100 | #42 | Exceptional 96.9% |
| Aleuts | 99.9 /100 | #43 | Exceptional 96.9% |
| Maltese | 99.9 /100 | #44 | Exceptional 96.9% |