Moroccan vs South African College, 1 year or more
COMPARE
Moroccan
South African
College, 1 year or more
College, 1 year or more Comparison
Moroccans
South Africans
60.2%
COLLEGE, 1 YEAR OR MORE
72.9/ 100
METRIC RATING
155th/ 347
METRIC RANK
64.1%
COLLEGE, 1 YEAR OR MORE
99.7/ 100
METRIC RATING
57th/ 347
METRIC RANK
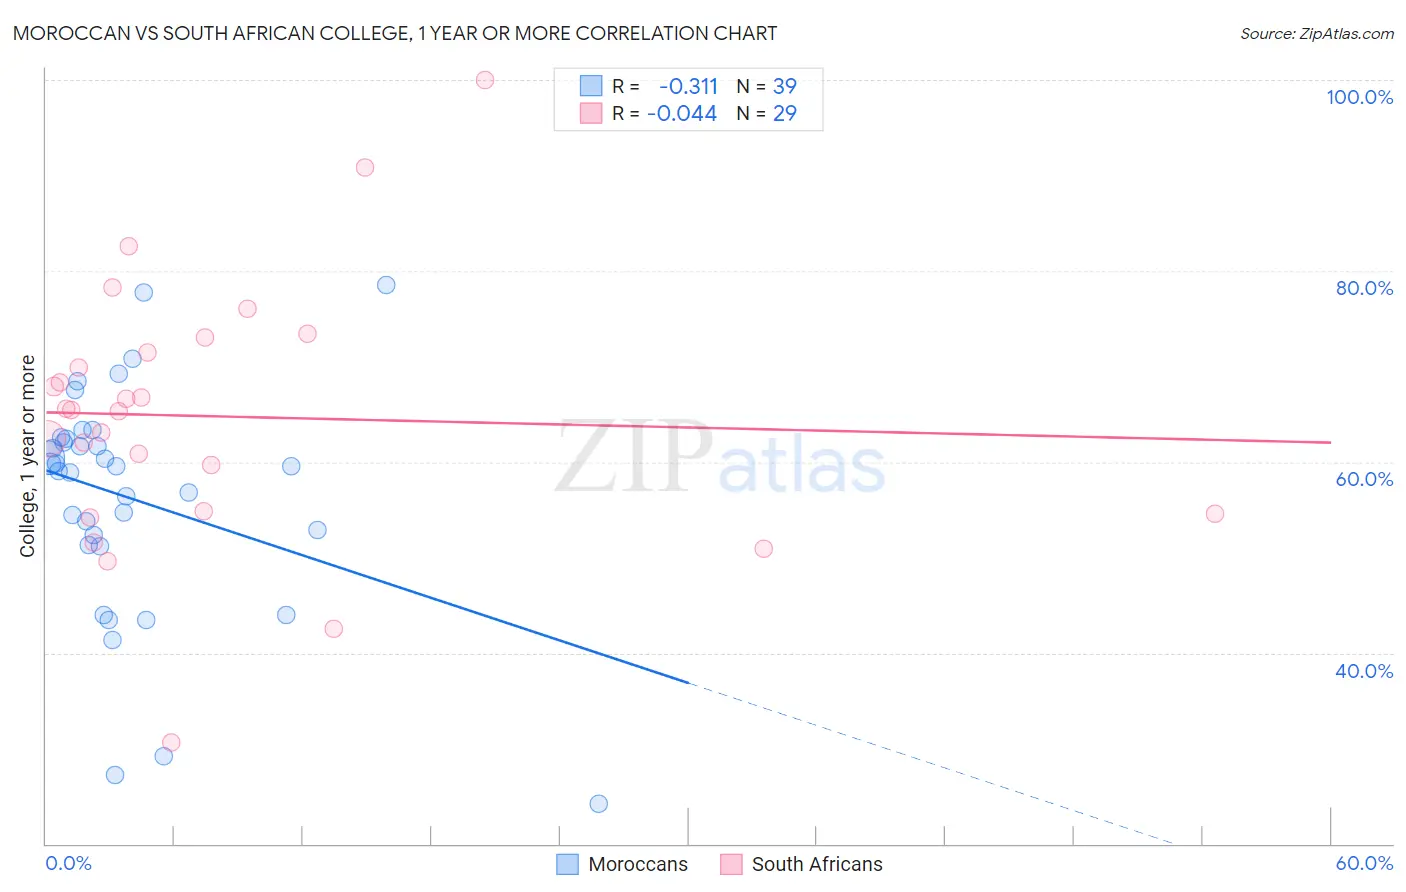
Moroccan vs South African College, 1 year or more Correlation Chart
The statistical analysis conducted on geographies consisting of 201,817,667 people shows a mild negative correlation between the proportion of Moroccans and percentage of population with at least college, 1 year or more education in the United States with a correlation coefficient (R) of -0.311 and weighted average of 60.2%. Similarly, the statistical analysis conducted on geographies consisting of 182,603,987 people shows no correlation between the proportion of South Africans and percentage of population with at least college, 1 year or more education in the United States with a correlation coefficient (R) of -0.044 and weighted average of 64.1%, a difference of 6.5%.
College, 1 year or more Correlation Summary
| Measurement | Moroccan | South African |
| Minimum | 24.2% | 30.6% |
| Maximum | 78.5% | 100.0% |
| Range | 54.2% | 69.4% |
| Mean | 56.1% | 64.8% |
| Median | 59.6% | 65.4% |
| Interquartile 25% (IQ1) | 51.3% | 54.7% |
| Interquartile 75% (IQ3) | 62.5% | 72.3% |
| Interquartile Range (IQR) | 11.2% | 17.6% |
| Standard Deviation (Sample) | 12.1% | 13.9% |
| Standard Deviation (Population) | 11.9% | 13.7% |
Similar Demographics by College, 1 year or more
Demographics Similar to Moroccans by College, 1 year or more
In terms of college, 1 year or more, the demographic groups most similar to Moroccans are Sudanese (60.2%, a difference of 0.0%), Finnish (60.2%, a difference of 0.0%), Sierra Leonean (60.2%, a difference of 0.080%), Immigrants from Germany (60.3%, a difference of 0.22%), and Immigrants from Armenia (60.0%, a difference of 0.26%).
| Demographics | Rating | Rank | College, 1 year or more |
| Kenyans | 79.0 /100 | #148 | Good 60.5% |
| Brazilians | 79.0 /100 | #149 | Good 60.5% |
| Immigrants | Sudan | 77.8 /100 | #150 | Good 60.4% |
| Albanians | 77.8 /100 | #151 | Good 60.4% |
| Immigrants | Germany | 76.1 /100 | #152 | Good 60.3% |
| Sierra Leoneans | 74.1 /100 | #153 | Good 60.2% |
| Sudanese | 73.0 /100 | #154 | Good 60.2% |
| Moroccans | 72.9 /100 | #155 | Good 60.2% |
| Finns | 72.9 /100 | #156 | Good 60.2% |
| Immigrants | Armenia | 68.8 /100 | #157 | Good 60.0% |
| English | 67.2 /100 | #158 | Good 60.0% |
| Immigrants | Iraq | 67.0 /100 | #159 | Good 60.0% |
| South American Indians | 66.9 /100 | #160 | Good 60.0% |
| Somalis | 64.5 /100 | #161 | Good 59.9% |
| Koreans | 58.5 /100 | #162 | Average 59.7% |
Demographics Similar to South Africans by College, 1 year or more
In terms of college, 1 year or more, the demographic groups most similar to South Africans are Immigrants from Czechoslovakia (64.1%, a difference of 0.010%), Immigrants from Belarus (64.1%, a difference of 0.040%), Immigrants from Asia (64.0%, a difference of 0.14%), Zimbabwean (64.2%, a difference of 0.16%), and Asian (64.2%, a difference of 0.19%).
| Demographics | Rating | Rank | College, 1 year or more |
| Immigrants | Austria | 99.8 /100 | #50 | Exceptional 64.4% |
| Immigrants | Malaysia | 99.8 /100 | #51 | Exceptional 64.3% |
| Immigrants | Netherlands | 99.8 /100 | #52 | Exceptional 64.2% |
| Asians | 99.8 /100 | #53 | Exceptional 64.2% |
| Zimbabweans | 99.8 /100 | #54 | Exceptional 64.2% |
| Immigrants | Belarus | 99.7 /100 | #55 | Exceptional 64.1% |
| Immigrants | Czechoslovakia | 99.7 /100 | #56 | Exceptional 64.1% |
| South Africans | 99.7 /100 | #57 | Exceptional 64.1% |
| Immigrants | Asia | 99.7 /100 | #58 | Exceptional 64.0% |
| Immigrants | Serbia | 99.6 /100 | #59 | Exceptional 63.8% |
| Immigrants | Kazakhstan | 99.5 /100 | #60 | Exceptional 63.6% |
| Bolivians | 99.5 /100 | #61 | Exceptional 63.5% |
| Immigrants | Indonesia | 99.5 /100 | #62 | Exceptional 63.5% |
| Immigrants | Scotland | 99.4 /100 | #63 | Exceptional 63.4% |
| Immigrants | Spain | 99.4 /100 | #64 | Exceptional 63.4% |