Luxembourger vs Spanish American Indian 10th Grade
COMPARE
Luxembourger
Spanish American Indian
10th Grade
10th Grade Comparison
Luxembourgers
Spanish American Indians
95.4%
10TH GRADE
100.0/ 100
METRIC RATING
28th/ 347
METRIC RANK
86.2%
10TH GRADE
0.0/ 100
METRIC RATING
346th/ 347
METRIC RANK
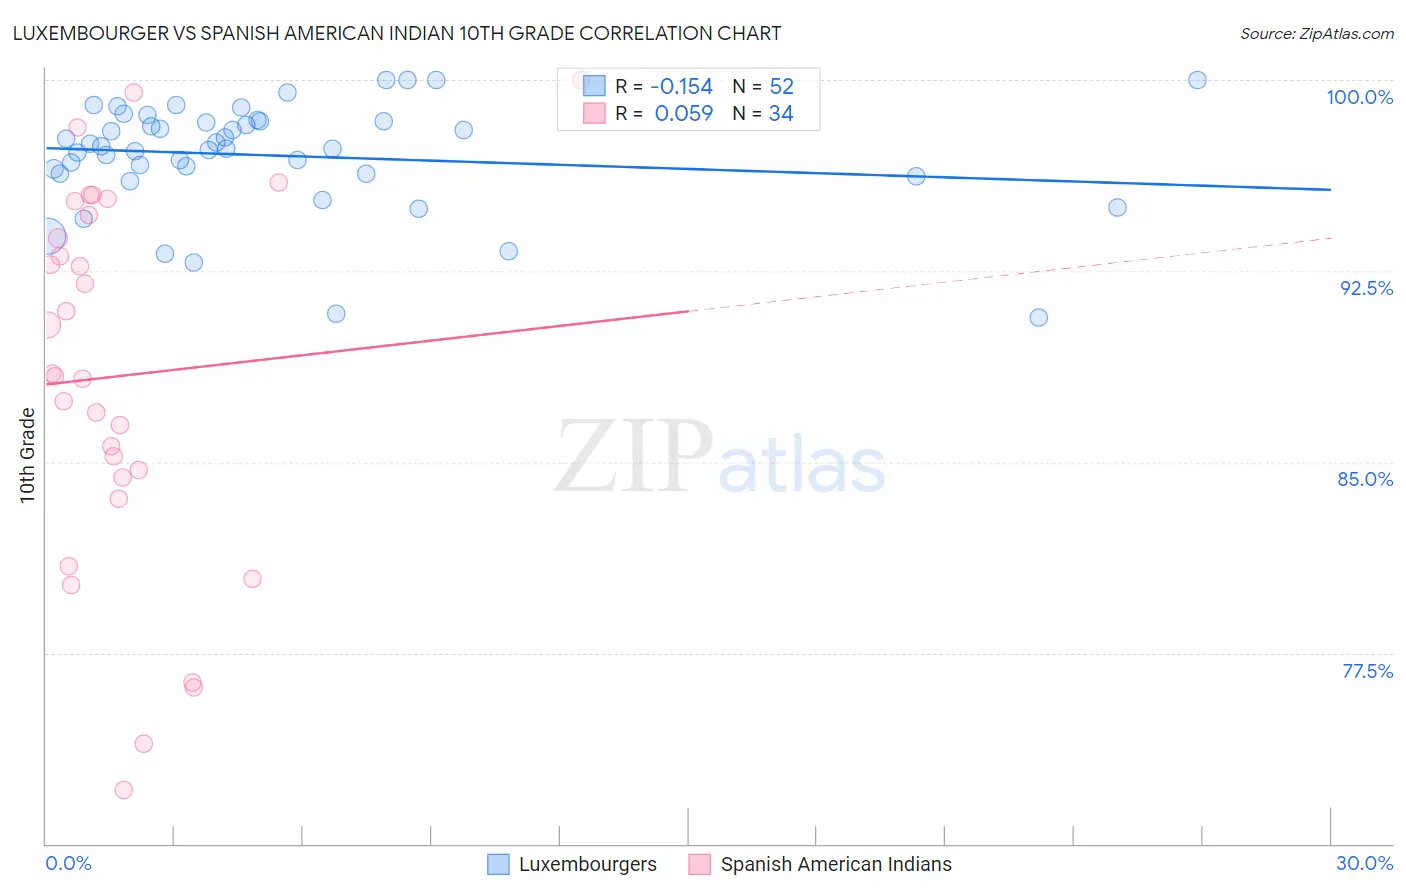
Luxembourger vs Spanish American Indian 10th Grade Correlation Chart
The statistical analysis conducted on geographies consisting of 144,675,955 people shows a poor negative correlation between the proportion of Luxembourgers and percentage of population with at least 10th grade education in the United States with a correlation coefficient (R) of -0.154 and weighted average of 95.4%. Similarly, the statistical analysis conducted on geographies consisting of 73,147,813 people shows a slight positive correlation between the proportion of Spanish American Indians and percentage of population with at least 10th grade education in the United States with a correlation coefficient (R) of 0.059 and weighted average of 86.2%, a difference of 10.7%.
10th Grade Correlation Summary
| Measurement | Luxembourger | Spanish American Indian |
| Minimum | 90.7% | 72.1% |
| Maximum | 100.0% | 100.0% |
| Range | 9.3% | 27.9% |
| Mean | 97.0% | 88.4% |
| Median | 97.4% | 88.4% |
| Interquartile 25% (IQ1) | 96.3% | 84.4% |
| Interquartile 75% (IQ3) | 98.4% | 94.7% |
| Interquartile Range (IQR) | 2.1% | 10.3% |
| Standard Deviation (Sample) | 2.1% | 7.4% |
| Standard Deviation (Population) | 2.1% | 7.3% |
Similar Demographics by 10th Grade
Demographics Similar to Luxembourgers by 10th Grade
In terms of 10th grade, the demographic groups most similar to Luxembourgers are Alaskan Athabascan (95.4%, a difference of 0.0%), Welsh (95.5%, a difference of 0.020%), Bulgarian (95.4%, a difference of 0.030%), European (95.5%, a difference of 0.040%), and Maltese (95.5%, a difference of 0.040%).
| Demographics | Rating | Rank | 10th Grade |
| Dutch | 100.0 /100 | #21 | Exceptional 95.5% |
| Eastern Europeans | 100.0 /100 | #22 | Exceptional 95.5% |
| Czechs | 100.0 /100 | #23 | Exceptional 95.5% |
| Europeans | 100.0 /100 | #24 | Exceptional 95.5% |
| Maltese | 100.0 /100 | #25 | Exceptional 95.5% |
| Welsh | 100.0 /100 | #26 | Exceptional 95.5% |
| Alaskan Athabascans | 100.0 /100 | #27 | Exceptional 95.4% |
| Luxembourgers | 100.0 /100 | #28 | Exceptional 95.4% |
| Bulgarians | 100.0 /100 | #29 | Exceptional 95.4% |
| Belgians | 100.0 /100 | #30 | Exceptional 95.4% |
| Iranians | 100.0 /100 | #31 | Exceptional 95.3% |
| Hungarians | 100.0 /100 | #32 | Exceptional 95.3% |
| French | 100.0 /100 | #33 | Exceptional 95.3% |
| British | 99.9 /100 | #34 | Exceptional 95.3% |
| Estonians | 99.9 /100 | #35 | Exceptional 95.3% |
Demographics Similar to Spanish American Indians by 10th Grade
In terms of 10th grade, the demographic groups most similar to Spanish American Indians are Immigrants from Mexico (86.2%, a difference of 0.010%), Immigrants from Central America (86.6%, a difference of 0.45%), Immigrants from El Salvador (86.8%, a difference of 0.63%), Yakama (86.9%, a difference of 0.77%), and Immigrants from Guatemala (87.4%, a difference of 1.4%).
| Demographics | Rating | Rank | 10th Grade |
| Hondurans | 0.0 /100 | #333 | Tragic 89.0% |
| Hispanics or Latinos | 0.0 /100 | #334 | Tragic 88.9% |
| Immigrants | Dominican Republic | 0.0 /100 | #335 | Tragic 88.7% |
| Immigrants | Honduras | 0.0 /100 | #336 | Tragic 88.5% |
| Central Americans | 0.0 /100 | #337 | Tragic 88.4% |
| Immigrants | Latin America | 0.0 /100 | #338 | Tragic 88.3% |
| Guatemalans | 0.0 /100 | #339 | Tragic 87.9% |
| Mexicans | 0.0 /100 | #340 | Tragic 87.8% |
| Salvadorans | 0.0 /100 | #341 | Tragic 87.5% |
| Immigrants | Guatemala | 0.0 /100 | #342 | Tragic 87.4% |
| Yakama | 0.0 /100 | #343 | Tragic 86.9% |
| Immigrants | El Salvador | 0.0 /100 | #344 | Tragic 86.8% |
| Immigrants | Central America | 0.0 /100 | #345 | Tragic 86.6% |
| Spanish American Indians | 0.0 /100 | #346 | Tragic 86.2% |
| Immigrants | Mexico | 0.0 /100 | #347 | Tragic 86.2% |