Immigrants from Nepal vs Spanish American Indian 10th Grade
COMPARE
Immigrants from Nepal
Spanish American Indian
10th Grade
10th Grade Comparison
Immigrants from Nepal
Spanish American Indians
93.7%
10TH GRADE
49.6/ 100
METRIC RATING
175th/ 347
METRIC RANK
86.2%
10TH GRADE
0.0/ 100
METRIC RATING
346th/ 347
METRIC RANK
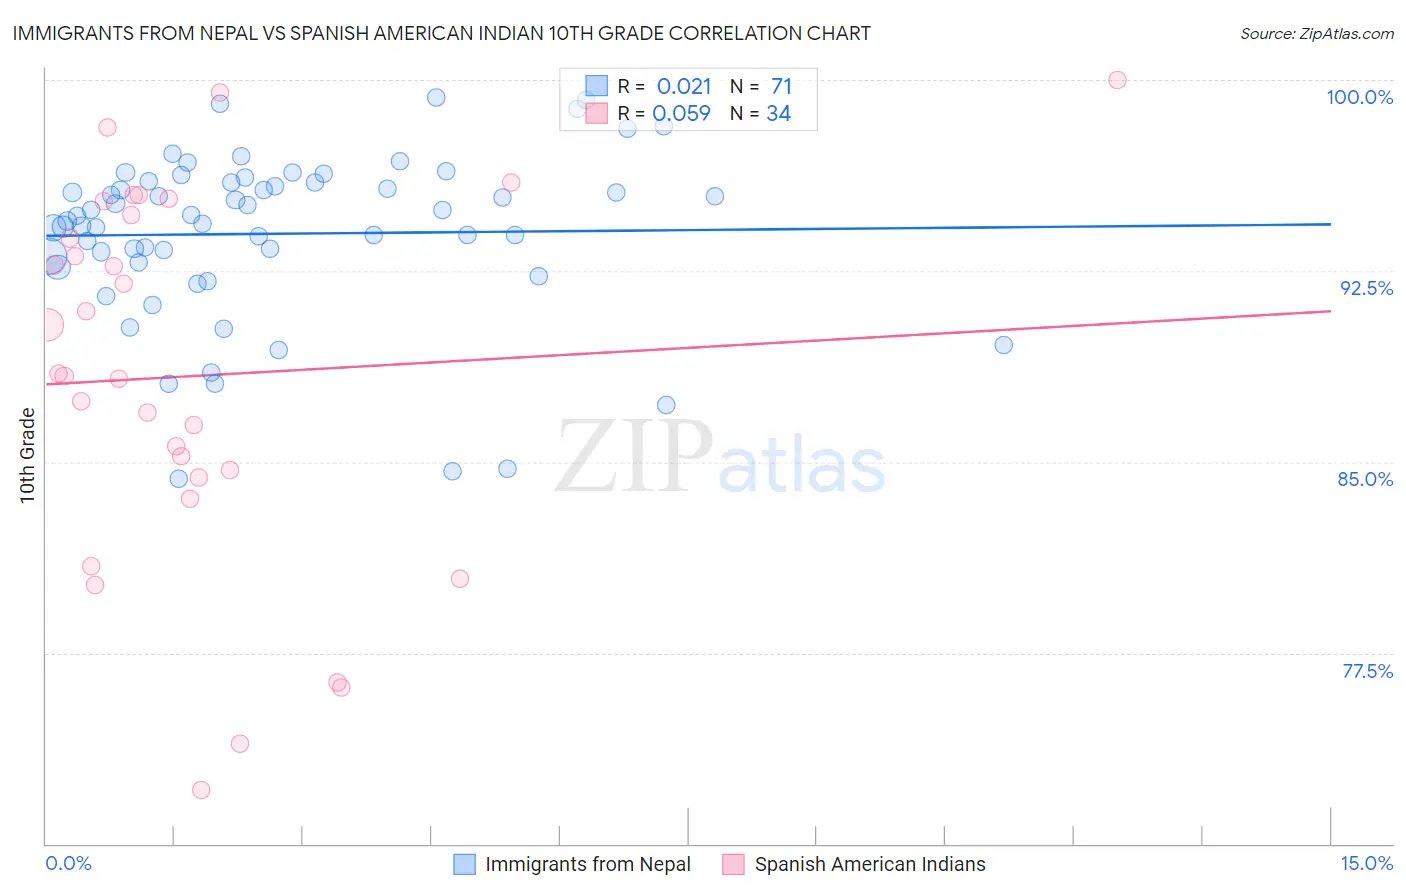
Immigrants from Nepal vs Spanish American Indian 10th Grade Correlation Chart
The statistical analysis conducted on geographies consisting of 186,636,986 people shows no correlation between the proportion of Immigrants from Nepal and percentage of population with at least 10th grade education in the United States with a correlation coefficient (R) of 0.021 and weighted average of 93.7%. Similarly, the statistical analysis conducted on geographies consisting of 73,147,813 people shows a slight positive correlation between the proportion of Spanish American Indians and percentage of population with at least 10th grade education in the United States with a correlation coefficient (R) of 0.059 and weighted average of 86.2%, a difference of 8.7%.
10th Grade Correlation Summary
| Measurement | Immigrants from Nepal | Spanish American Indian |
| Minimum | 84.3% | 72.1% |
| Maximum | 99.3% | 100.0% |
| Range | 15.0% | 27.9% |
| Mean | 94.0% | 88.4% |
| Median | 94.7% | 88.4% |
| Interquartile 25% (IQ1) | 92.8% | 84.4% |
| Interquartile 75% (IQ3) | 96.0% | 94.7% |
| Interquartile Range (IQR) | 3.2% | 10.3% |
| Standard Deviation (Sample) | 3.3% | 7.4% |
| Standard Deviation (Population) | 3.3% | 7.3% |
Similar Demographics by 10th Grade
Demographics Similar to Immigrants from Nepal by 10th Grade
In terms of 10th grade, the demographic groups most similar to Immigrants from Nepal are Argentinean (93.7%, a difference of 0.0%), French American Indian (93.7%, a difference of 0.010%), Spaniard (93.7%, a difference of 0.010%), Immigrants from Albania (93.8%, a difference of 0.020%), and Immigrants from Argentina (93.7%, a difference of 0.020%).
| Demographics | Rating | Rank | 10th Grade |
| Alsatians | 59.4 /100 | #168 | Average 93.8% |
| Immigrants | Spain | 55.9 /100 | #169 | Average 93.8% |
| Immigrants | Venezuela | 53.9 /100 | #170 | Average 93.8% |
| Immigrants | Albania | 52.4 /100 | #171 | Average 93.8% |
| French American Indians | 50.9 /100 | #172 | Average 93.7% |
| Spaniards | 50.3 /100 | #173 | Average 93.7% |
| Argentineans | 50.0 /100 | #174 | Average 93.7% |
| Immigrants | Nepal | 49.6 /100 | #175 | Average 93.7% |
| Immigrants | Argentina | 47.1 /100 | #176 | Average 93.7% |
| Immigrants | Lebanon | 47.1 /100 | #177 | Average 93.7% |
| Sierra Leoneans | 46.1 /100 | #178 | Average 93.7% |
| Paraguayans | 45.3 /100 | #179 | Average 93.7% |
| Blackfeet | 42.8 /100 | #180 | Average 93.7% |
| Immigrants | Northern Africa | 41.6 /100 | #181 | Average 93.7% |
| Colville | 38.8 /100 | #182 | Fair 93.6% |
Demographics Similar to Spanish American Indians by 10th Grade
In terms of 10th grade, the demographic groups most similar to Spanish American Indians are Immigrants from Mexico (86.2%, a difference of 0.010%), Immigrants from Central America (86.6%, a difference of 0.45%), Immigrants from El Salvador (86.8%, a difference of 0.63%), Yakama (86.9%, a difference of 0.77%), and Immigrants from Guatemala (87.4%, a difference of 1.4%).
| Demographics | Rating | Rank | 10th Grade |
| Hondurans | 0.0 /100 | #333 | Tragic 89.0% |
| Hispanics or Latinos | 0.0 /100 | #334 | Tragic 88.9% |
| Immigrants | Dominican Republic | 0.0 /100 | #335 | Tragic 88.7% |
| Immigrants | Honduras | 0.0 /100 | #336 | Tragic 88.5% |
| Central Americans | 0.0 /100 | #337 | Tragic 88.4% |
| Immigrants | Latin America | 0.0 /100 | #338 | Tragic 88.3% |
| Guatemalans | 0.0 /100 | #339 | Tragic 87.9% |
| Mexicans | 0.0 /100 | #340 | Tragic 87.8% |
| Salvadorans | 0.0 /100 | #341 | Tragic 87.5% |
| Immigrants | Guatemala | 0.0 /100 | #342 | Tragic 87.4% |
| Yakama | 0.0 /100 | #343 | Tragic 86.9% |
| Immigrants | El Salvador | 0.0 /100 | #344 | Tragic 86.8% |
| Immigrants | Central America | 0.0 /100 | #345 | Tragic 86.6% |
| Spanish American Indians | 0.0 /100 | #346 | Tragic 86.2% |
| Immigrants | Mexico | 0.0 /100 | #347 | Tragic 86.2% |