Norwegian vs Bangladeshi 11th Grade
COMPARE
Norwegian
Bangladeshi
11th Grade
11th Grade Comparison
Norwegians
Bangladeshis
95.2%
11TH GRADE
100.0/ 100
METRIC RATING
1st/ 347
METRIC RANK
90.9%
11TH GRADE
0.1/ 100
METRIC RATING
276th/ 347
METRIC RANK
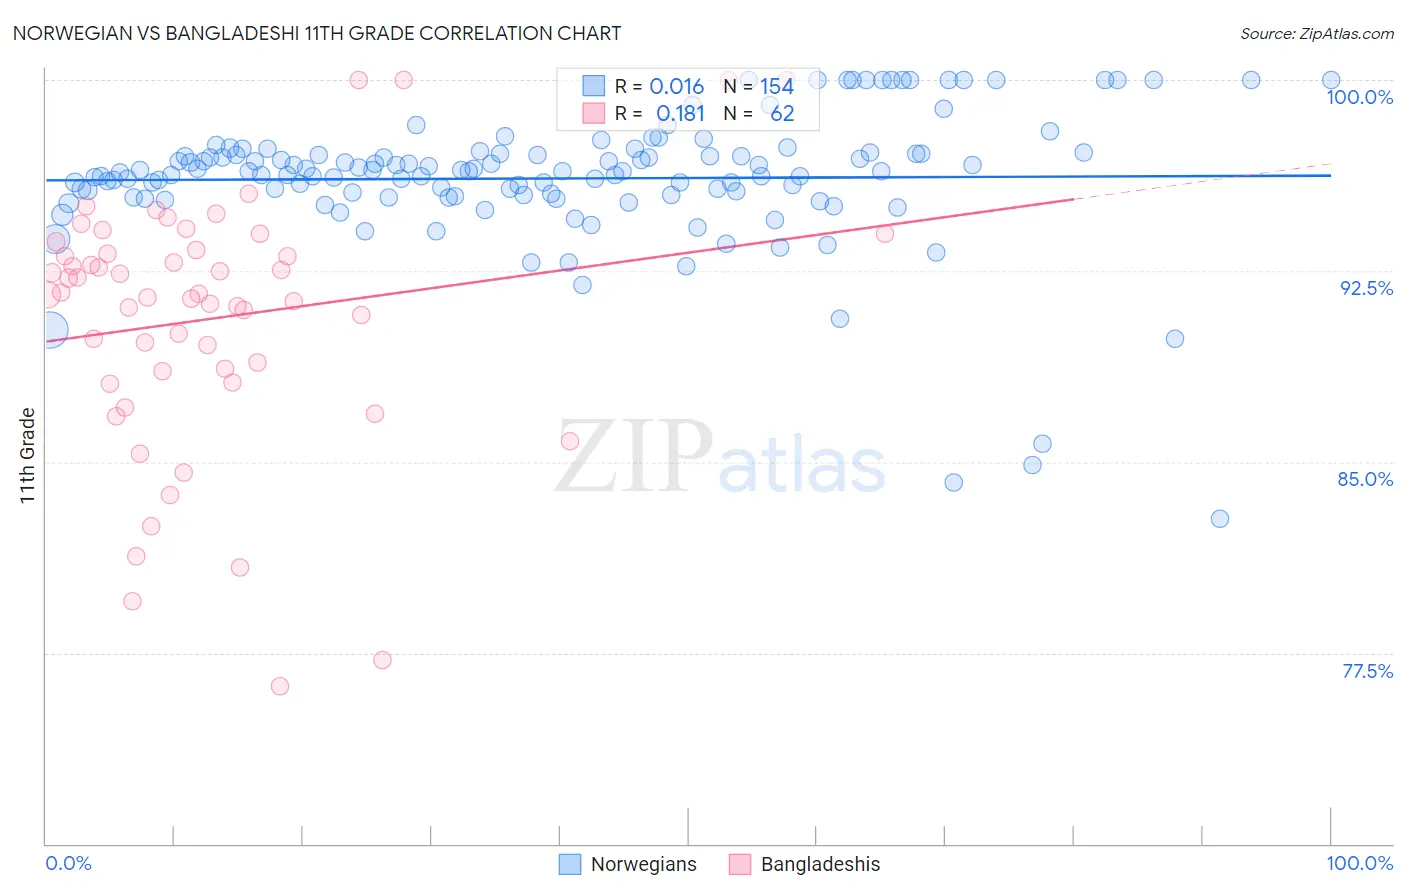
Norwegian vs Bangladeshi 11th Grade Correlation Chart
The statistical analysis conducted on geographies consisting of 533,395,805 people shows no correlation between the proportion of Norwegians and percentage of population with at least 11th grade education in the United States with a correlation coefficient (R) of 0.016 and weighted average of 95.2%. Similarly, the statistical analysis conducted on geographies consisting of 141,450,108 people shows a poor positive correlation between the proportion of Bangladeshis and percentage of population with at least 11th grade education in the United States with a correlation coefficient (R) of 0.181 and weighted average of 90.9%, a difference of 4.8%.
11th Grade Correlation Summary
| Measurement | Norwegian | Bangladeshi |
| Minimum | 82.8% | 76.2% |
| Maximum | 100.0% | 100.0% |
| Range | 17.2% | 23.8% |
| Mean | 96.1% | 90.6% |
| Median | 96.4% | 91.6% |
| Interquartile 25% (IQ1) | 95.5% | 88.5% |
| Interquartile 75% (IQ3) | 97.1% | 93.3% |
| Interquartile Range (IQR) | 1.6% | 4.8% |
| Standard Deviation (Sample) | 2.7% | 5.0% |
| Standard Deviation (Population) | 2.7% | 5.0% |
Similar Demographics by 11th Grade
Demographics Similar to Norwegians by 11th Grade
In terms of 11th grade, the demographic groups most similar to Norwegians are Swedish (94.9%, a difference of 0.28%), Slovene (94.9%, a difference of 0.30%), Slovak (94.9%, a difference of 0.32%), Carpatho Rusyn (94.8%, a difference of 0.38%), and Lithuanian (94.8%, a difference of 0.43%).
| Demographics | Rating | Rank | 11th Grade |
| Norwegians | 100.0 /100 | #1 | Exceptional 95.2% |
| Swedes | 100.0 /100 | #2 | Exceptional 94.9% |
| Slovenes | 100.0 /100 | #3 | Exceptional 94.9% |
| Slovaks | 100.0 /100 | #4 | Exceptional 94.9% |
| Carpatho Rusyns | 100.0 /100 | #5 | Exceptional 94.8% |
| Lithuanians | 100.0 /100 | #6 | Exceptional 94.8% |
| Poles | 100.0 /100 | #7 | Exceptional 94.8% |
| Croatians | 100.0 /100 | #8 | Exceptional 94.7% |
| Danes | 100.0 /100 | #9 | Exceptional 94.7% |
| Finns | 100.0 /100 | #10 | Exceptional 94.7% |
| Germans | 100.0 /100 | #11 | Exceptional 94.7% |
| Latvians | 100.0 /100 | #12 | Exceptional 94.7% |
| Chinese | 100.0 /100 | #13 | Exceptional 94.6% |
| Eastern Europeans | 100.0 /100 | #14 | Exceptional 94.6% |
| Bulgarians | 100.0 /100 | #15 | Exceptional 94.5% |
Demographics Similar to Bangladeshis by 11th Grade
In terms of 11th grade, the demographic groups most similar to Bangladeshis are Immigrants from Congo (90.9%, a difference of 0.020%), Malaysian (90.8%, a difference of 0.050%), Immigrants from South Eastern Asia (90.9%, a difference of 0.070%), Immigrants from Trinidad and Tobago (90.9%, a difference of 0.080%), and Barbadian (90.8%, a difference of 0.10%).
| Demographics | Rating | Rank | 11th Grade |
| Ute | 0.2 /100 | #269 | Tragic 91.1% |
| Trinidadians and Tobagonians | 0.2 /100 | #270 | Tragic 91.1% |
| Immigrants | Peru | 0.1 /100 | #271 | Tragic 91.0% |
| West Indians | 0.1 /100 | #272 | Tragic 91.0% |
| Paiute | 0.1 /100 | #273 | Tragic 91.0% |
| Immigrants | Trinidad and Tobago | 0.1 /100 | #274 | Tragic 90.9% |
| Immigrants | South Eastern Asia | 0.1 /100 | #275 | Tragic 90.9% |
| Bangladeshis | 0.1 /100 | #276 | Tragic 90.9% |
| Immigrants | Congo | 0.1 /100 | #277 | Tragic 90.9% |
| Malaysians | 0.1 /100 | #278 | Tragic 90.8% |
| Barbadians | 0.0 /100 | #279 | Tragic 90.8% |
| Sri Lankans | 0.0 /100 | #280 | Tragic 90.7% |
| Dutch West Indians | 0.0 /100 | #281 | Tragic 90.7% |
| Immigrants | St. Vincent and the Grenadines | 0.0 /100 | #282 | Tragic 90.7% |
| Immigrants | Barbados | 0.0 /100 | #283 | Tragic 90.7% |