Syrian vs Senegalese Doctorate Degree
COMPARE
Syrian
Senegalese
Doctorate Degree
Doctorate Degree Comparison
Syrians
Senegalese
2.1%
DOCTORATE DEGREE
97.1/ 100
METRIC RATING
112th/ 347
METRIC RANK
2.0%
DOCTORATE DEGREE
86.7/ 100
METRIC RATING
141st/ 347
METRIC RANK
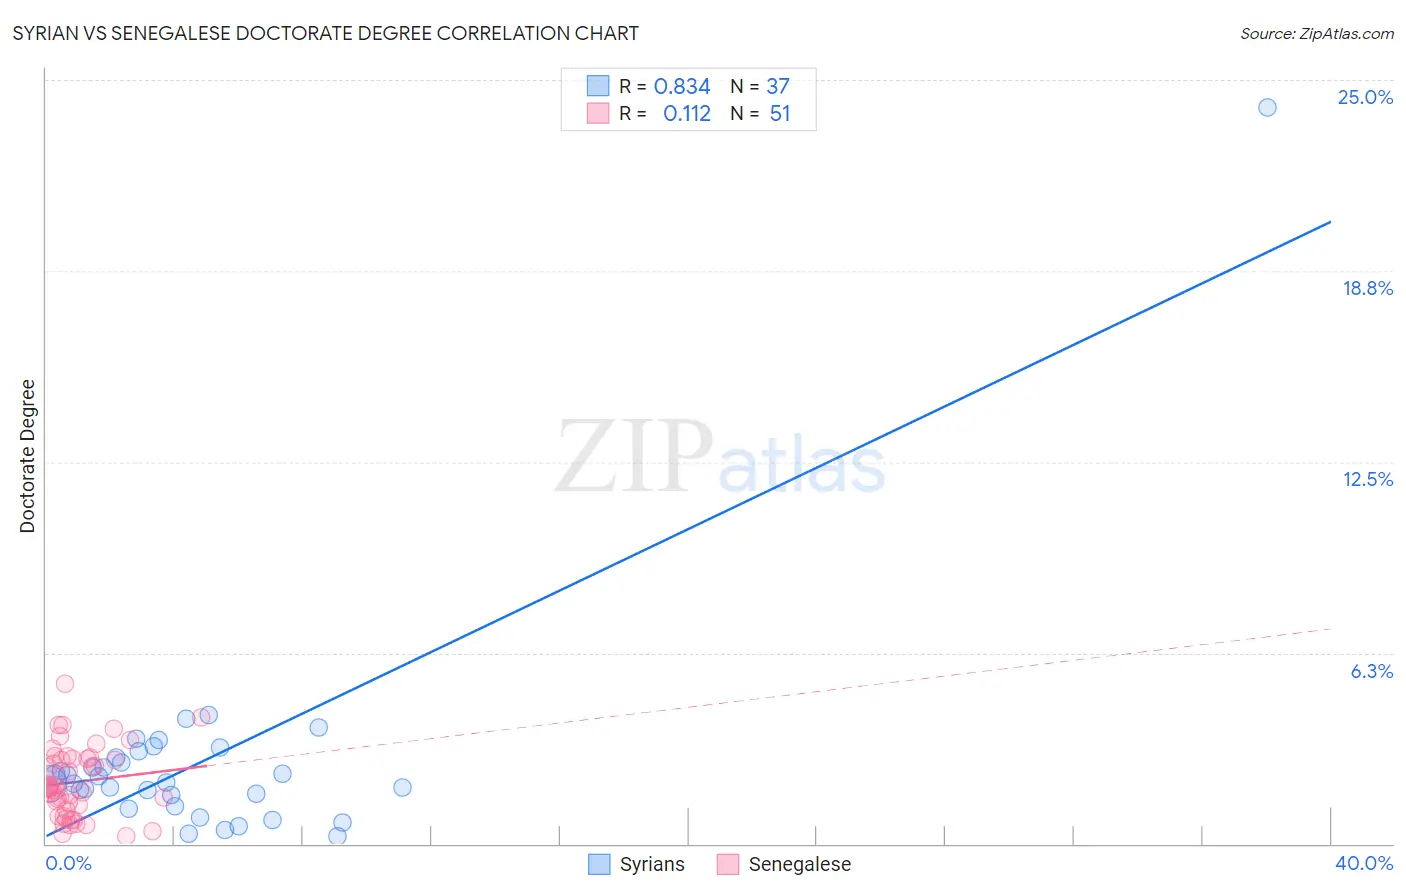
Syrian vs Senegalese Doctorate Degree Correlation Chart
The statistical analysis conducted on geographies consisting of 265,258,861 people shows a very strong positive correlation between the proportion of Syrians and percentage of population with at least doctorate degree education in the United States with a correlation coefficient (R) of 0.834 and weighted average of 2.1%. Similarly, the statistical analysis conducted on geographies consisting of 78,037,705 people shows a poor positive correlation between the proportion of Senegalese and percentage of population with at least doctorate degree education in the United States with a correlation coefficient (R) of 0.112 and weighted average of 2.0%, a difference of 5.6%.
Doctorate Degree Correlation Summary
| Measurement | Syrian | Senegalese |
| Minimum | 0.24% | 0.24% |
| Maximum | 24.1% | 5.2% |
| Range | 23.9% | 5.0% |
| Mean | 2.7% | 2.0% |
| Median | 2.0% | 1.8% |
| Interquartile 25% (IQ1) | 1.4% | 1.1% |
| Interquartile 75% (IQ3) | 2.9% | 2.8% |
| Interquartile Range (IQR) | 1.5% | 1.7% |
| Standard Deviation (Sample) | 3.8% | 1.1% |
| Standard Deviation (Population) | 3.7% | 1.1% |
Similar Demographics by Doctorate Degree
Demographics Similar to Syrians by Doctorate Degree
In terms of doctorate degree, the demographic groups most similar to Syrians are Immigrants from Pakistan (2.1%, a difference of 0.020%), Brazilian (2.1%, a difference of 0.080%), Ukrainian (2.1%, a difference of 0.15%), Immigrants from Germany (2.1%, a difference of 0.21%), and Immigrants from Italy (2.1%, a difference of 0.21%).
| Demographics | Rating | Rank | Doctorate Degree |
| Arabs | 97.8 /100 | #105 | Exceptional 2.1% |
| Sudanese | 97.7 /100 | #106 | Exceptional 2.1% |
| Europeans | 97.5 /100 | #107 | Exceptional 2.1% |
| Immigrants | Germany | 97.3 /100 | #108 | Exceptional 2.1% |
| Ukrainians | 97.2 /100 | #109 | Exceptional 2.1% |
| Brazilians | 97.2 /100 | #110 | Exceptional 2.1% |
| Immigrants | Pakistan | 97.1 /100 | #111 | Exceptional 2.1% |
| Syrians | 97.1 /100 | #112 | Exceptional 2.1% |
| Immigrants | Italy | 96.9 /100 | #113 | Exceptional 2.1% |
| Immigrants | Croatia | 96.8 /100 | #114 | Exceptional 2.1% |
| Taiwanese | 96.7 /100 | #115 | Exceptional 2.1% |
| Maltese | 96.2 /100 | #116 | Exceptional 2.1% |
| Lebanese | 96.0 /100 | #117 | Exceptional 2.1% |
| Icelanders | 96.0 /100 | #118 | Exceptional 2.1% |
| Pakistanis | 95.8 /100 | #119 | Exceptional 2.0% |
Demographics Similar to Senegalese by Doctorate Degree
In terms of doctorate degree, the demographic groups most similar to Senegalese are Immigrants from Africa (2.0%, a difference of 0.070%), Afghan (2.0%, a difference of 0.16%), Italian (2.0%, a difference of 0.21%), Swiss (2.0%, a difference of 0.38%), and Sierra Leonean (2.0%, a difference of 0.46%).
| Demographics | Rating | Rank | Doctorate Degree |
| Immigrants | Cameroon | 88.9 /100 | #134 | Excellent 2.0% |
| Serbians | 88.7 /100 | #135 | Excellent 2.0% |
| Swedes | 88.3 /100 | #136 | Excellent 2.0% |
| South American Indians | 88.3 /100 | #137 | Excellent 2.0% |
| Swiss | 88.0 /100 | #138 | Excellent 2.0% |
| Afghans | 87.2 /100 | #139 | Excellent 2.0% |
| Immigrants | Africa | 87.0 /100 | #140 | Excellent 2.0% |
| Senegalese | 86.7 /100 | #141 | Excellent 2.0% |
| Italians | 86.0 /100 | #142 | Excellent 2.0% |
| Sierra Leoneans | 85.1 /100 | #143 | Excellent 2.0% |
| Immigrants | Moldova | 84.3 /100 | #144 | Excellent 2.0% |
| Kenyans | 83.6 /100 | #145 | Excellent 1.9% |
| Immigrants | Syria | 83.6 /100 | #146 | Excellent 1.9% |
| Immigrants | Senegal | 82.5 /100 | #147 | Excellent 1.9% |
| Luxembourgers | 81.1 /100 | #148 | Excellent 1.9% |