Immigrants from Sudan vs Scotch-Irish 2nd Grade
COMPARE
Immigrants from Sudan
Scotch-Irish
2nd Grade
2nd Grade Comparison
Immigrants from Sudan
Scotch-Irish
97.6%
2ND GRADE
4.5/ 100
METRIC RATING
222nd/ 347
METRIC RANK
98.5%
2ND GRADE
100.0/ 100
METRIC RATING
25th/ 347
METRIC RANK
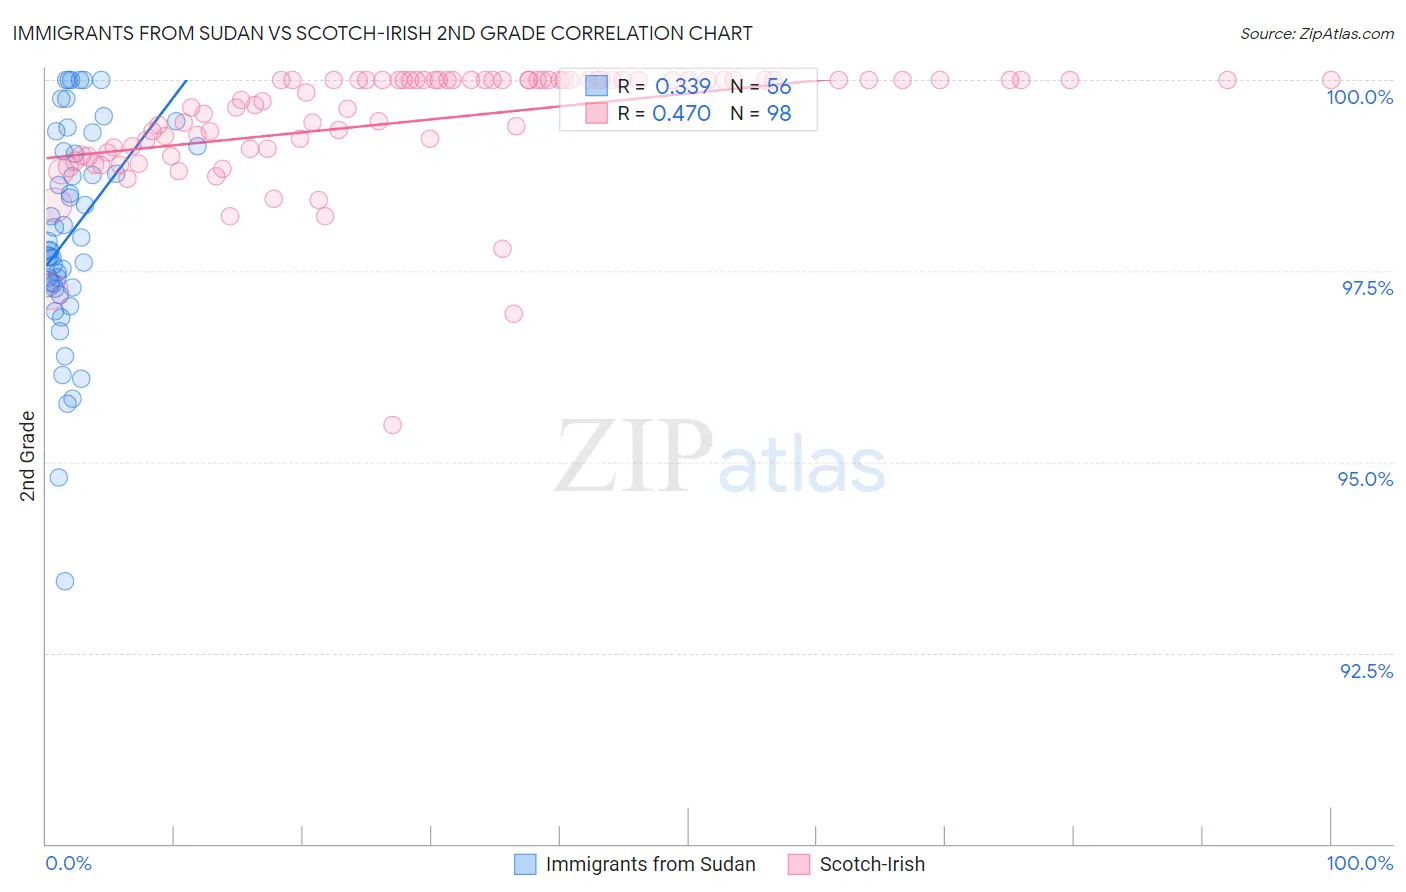
Immigrants from Sudan vs Scotch-Irish 2nd Grade Correlation Chart
The statistical analysis conducted on geographies consisting of 118,957,985 people shows a mild positive correlation between the proportion of Immigrants from Sudan and percentage of population with at least 2nd grade education in the United States with a correlation coefficient (R) of 0.339 and weighted average of 97.6%. Similarly, the statistical analysis conducted on geographies consisting of 548,777,407 people shows a moderate positive correlation between the proportion of Scotch-Irish and percentage of population with at least 2nd grade education in the United States with a correlation coefficient (R) of 0.470 and weighted average of 98.5%, a difference of 0.93%.
2nd Grade Correlation Summary
| Measurement | Immigrants from Sudan | Scotch-Irish |
| Minimum | 93.4% | 95.5% |
| Maximum | 100.0% | 100.0% |
| Range | 6.6% | 4.5% |
| Mean | 98.0% | 99.5% |
| Median | 97.8% | 99.9% |
| Interquartile 25% (IQ1) | 97.3% | 99.1% |
| Interquartile 75% (IQ3) | 99.1% | 100.0% |
| Interquartile Range (IQR) | 1.8% | 0.90% |
| Standard Deviation (Sample) | 1.4% | 0.77% |
| Standard Deviation (Population) | 1.4% | 0.76% |
Similar Demographics by 2nd Grade
Demographics Similar to Immigrants from Sudan by 2nd Grade
In terms of 2nd grade, the demographic groups most similar to Immigrants from Sudan are Iraqi (97.6%, a difference of 0.0%), Sierra Leonean (97.6%, a difference of 0.0%), Immigrants from Zaire (97.6%, a difference of 0.0%), Tongan (97.6%, a difference of 0.0%), and Immigrants from Panama (97.6%, a difference of 0.010%).
| Demographics | Rating | Rank | 2nd Grade |
| Bahamians | 6.8 /100 | #215 | Tragic 97.7% |
| South American Indians | 6.7 /100 | #216 | Tragic 97.7% |
| Uruguayans | 6.2 /100 | #217 | Tragic 97.7% |
| Sudanese | 5.7 /100 | #218 | Tragic 97.7% |
| Immigrants | Panama | 5.1 /100 | #219 | Tragic 97.6% |
| Immigrants | Morocco | 5.0 /100 | #220 | Tragic 97.6% |
| Iraqis | 4.6 /100 | #221 | Tragic 97.6% |
| Immigrants | Sudan | 4.5 /100 | #222 | Tragic 97.6% |
| Sierra Leoneans | 4.3 /100 | #223 | Tragic 97.6% |
| Immigrants | Zaire | 4.3 /100 | #224 | Tragic 97.6% |
| Tongans | 4.3 /100 | #225 | Tragic 97.6% |
| Immigrants | Syria | 4.0 /100 | #226 | Tragic 97.6% |
| Immigrants | Nepal | 4.0 /100 | #227 | Tragic 97.6% |
| Sub-Saharan Africans | 3.4 /100 | #228 | Tragic 97.6% |
| Immigrants | Costa Rica | 3.1 /100 | #229 | Tragic 97.6% |
Demographics Similar to Scotch-Irish by 2nd Grade
In terms of 2nd grade, the demographic groups most similar to Scotch-Irish are Polish (98.5%, a difference of 0.0%), Danish (98.5%, a difference of 0.0%), Pennsylvania German (98.5%, a difference of 0.0%), Finnish (98.5%, a difference of 0.010%), and Sioux (98.5%, a difference of 0.010%).
| Demographics | Rating | Rank | 2nd Grade |
| Irish | 100.0 /100 | #18 | Exceptional 98.6% |
| Finns | 100.0 /100 | #19 | Exceptional 98.5% |
| Sioux | 100.0 /100 | #20 | Exceptional 98.5% |
| Lithuanians | 100.0 /100 | #21 | Exceptional 98.5% |
| Poles | 100.0 /100 | #22 | Exceptional 98.5% |
| Danes | 100.0 /100 | #23 | Exceptional 98.5% |
| Pennsylvania Germans | 100.0 /100 | #24 | Exceptional 98.5% |
| Scotch-Irish | 100.0 /100 | #25 | Exceptional 98.5% |
| Welsh | 100.0 /100 | #26 | Exceptional 98.5% |
| Croatians | 100.0 /100 | #27 | Exceptional 98.5% |
| Arapaho | 100.0 /100 | #28 | Exceptional 98.5% |
| French | 100.0 /100 | #29 | Exceptional 98.5% |
| Europeans | 100.0 /100 | #30 | Exceptional 98.5% |
| Czechs | 100.0 /100 | #31 | Exceptional 98.5% |
| French Canadians | 100.0 /100 | #32 | Exceptional 98.5% |