Swiss vs Immigrants from Scotland Master's Degree
COMPARE
Swiss
Immigrants from Scotland
Master's Degree
Master's Degree Comparison
Swiss
Immigrants from Scotland
14.7%
MASTER'S DEGREE
41.1/ 100
METRIC RATING
181st/ 347
METRIC RANK
17.4%
MASTER'S DEGREE
99.4/ 100
METRIC RATING
84th/ 347
METRIC RANK
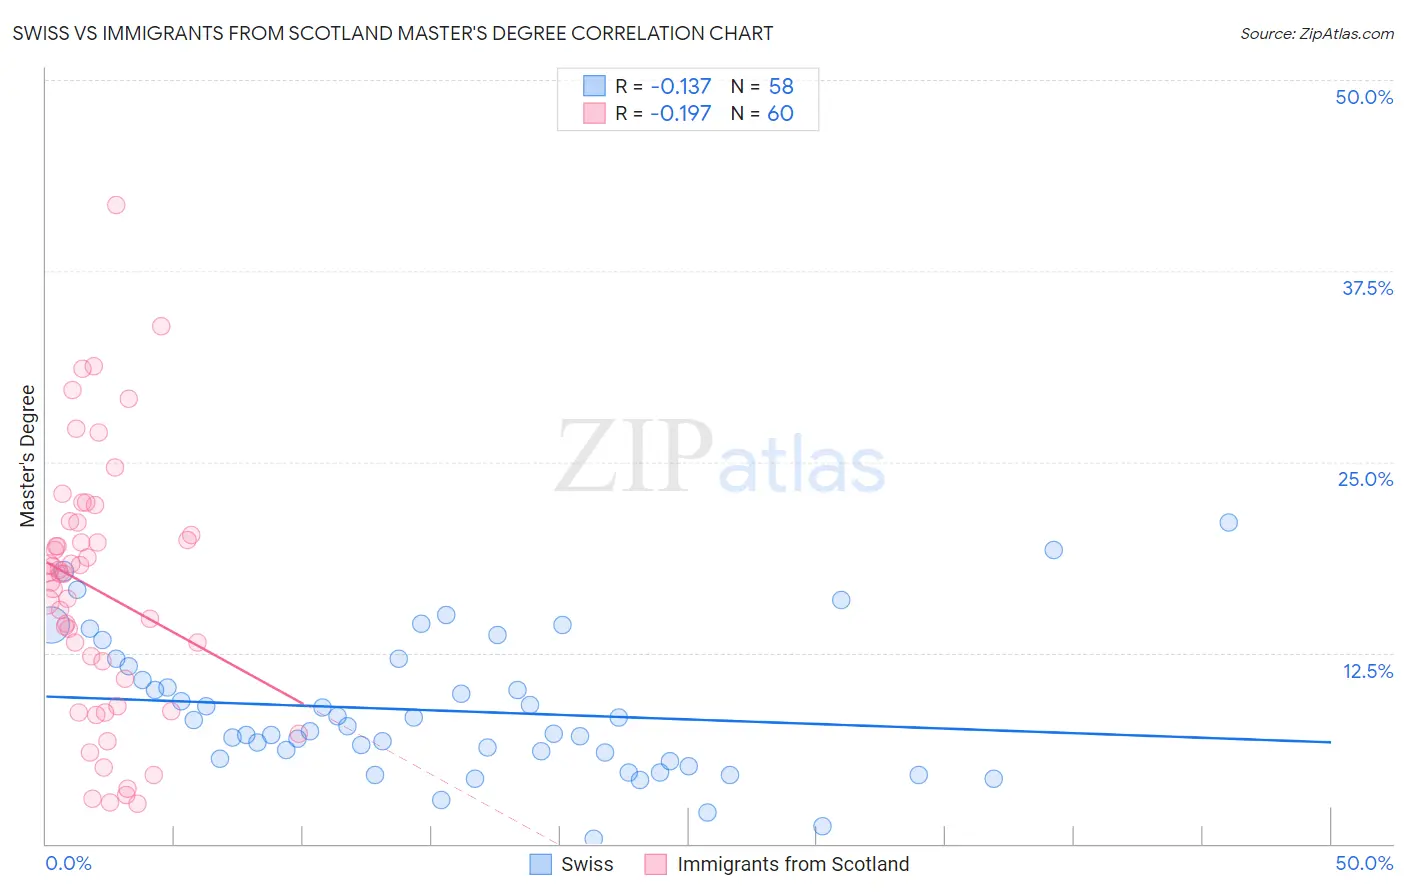
Swiss vs Immigrants from Scotland Master's Degree Correlation Chart
The statistical analysis conducted on geographies consisting of 464,796,332 people shows a poor negative correlation between the proportion of Swiss and percentage of population with at least master's degree education in the United States with a correlation coefficient (R) of -0.137 and weighted average of 14.7%. Similarly, the statistical analysis conducted on geographies consisting of 196,383,554 people shows a poor negative correlation between the proportion of Immigrants from Scotland and percentage of population with at least master's degree education in the United States with a correlation coefficient (R) of -0.197 and weighted average of 17.4%, a difference of 17.9%.
Master's Degree Correlation Summary
| Measurement | Swiss | Immigrants from Scotland |
| Minimum | 0.35% | 2.6% |
| Maximum | 21.1% | 41.8% |
| Range | 20.7% | 39.2% |
| Mean | 8.7% | 16.6% |
| Median | 7.6% | 17.7% |
| Interquartile 25% (IQ1) | 5.5% | 9.9% |
| Interquartile 75% (IQ3) | 11.6% | 20.6% |
| Interquartile Range (IQR) | 6.1% | 10.7% |
| Standard Deviation (Sample) | 4.5% | 8.4% |
| Standard Deviation (Population) | 4.5% | 8.3% |
Similar Demographics by Master's Degree
Demographics Similar to Swiss by Master's Degree
In terms of master's degree, the demographic groups most similar to Swiss are Celtic (14.8%, a difference of 0.020%), Immigrants from Iraq (14.8%, a difference of 0.030%), Czech (14.7%, a difference of 0.10%), Sri Lankan (14.7%, a difference of 0.20%), and Immigrants from Zaire (14.7%, a difference of 0.22%).
| Demographics | Rating | Rank | Master's Degree |
| Slovaks | 50.0 /100 | #174 | Average 14.9% |
| Immigrants | Peru | 49.6 /100 | #175 | Average 14.9% |
| Nigerians | 48.6 /100 | #176 | Average 14.9% |
| Immigrants | Colombia | 48.3 /100 | #177 | Average 14.9% |
| English | 45.0 /100 | #178 | Average 14.8% |
| Immigrants | Iraq | 41.3 /100 | #179 | Average 14.8% |
| Celtics | 41.3 /100 | #180 | Average 14.8% |
| Swiss | 41.1 /100 | #181 | Average 14.7% |
| Czechs | 40.4 /100 | #182 | Average 14.7% |
| Sri Lankans | 39.6 /100 | #183 | Fair 14.7% |
| Immigrants | Zaire | 39.5 /100 | #184 | Fair 14.7% |
| Barbadians | 38.3 /100 | #185 | Fair 14.7% |
| Immigrants | Oceania | 37.1 /100 | #186 | Fair 14.7% |
| Basques | 36.5 /100 | #187 | Fair 14.7% |
| Immigrants | Costa Rica | 36.2 /100 | #188 | Fair 14.7% |
Demographics Similar to Immigrants from Scotland by Master's Degree
In terms of master's degree, the demographic groups most similar to Immigrants from Scotland are Immigrants from Brazil (17.4%, a difference of 0.18%), Immigrants from Zimbabwe (17.4%, a difference of 0.33%), Greek (17.5%, a difference of 0.39%), Immigrants from Western Asia (17.5%, a difference of 0.44%), and Immigrants from Croatia (17.3%, a difference of 0.59%).
| Demographics | Rating | Rank | Master's Degree |
| Immigrants | Eastern Europe | 99.6 /100 | #77 | Exceptional 17.6% |
| Immigrants | Hungary | 99.6 /100 | #78 | Exceptional 17.5% |
| Immigrants | Lebanon | 99.6 /100 | #79 | Exceptional 17.5% |
| Carpatho Rusyns | 99.6 /100 | #80 | Exceptional 17.5% |
| Immigrants | Western Asia | 99.5 /100 | #81 | Exceptional 17.5% |
| Greeks | 99.5 /100 | #82 | Exceptional 17.5% |
| Immigrants | Zimbabwe | 99.5 /100 | #83 | Exceptional 17.4% |
| Immigrants | Scotland | 99.4 /100 | #84 | Exceptional 17.4% |
| Immigrants | Brazil | 99.4 /100 | #85 | Exceptional 17.4% |
| Immigrants | Croatia | 99.3 /100 | #86 | Exceptional 17.3% |
| Maltese | 99.3 /100 | #87 | Exceptional 17.3% |
| Immigrants | Canada | 99.2 /100 | #88 | Exceptional 17.2% |
| Bhutanese | 99.1 /100 | #89 | Exceptional 17.2% |
| Immigrants | Egypt | 99.1 /100 | #90 | Exceptional 17.2% |
| Romanians | 99.1 /100 | #91 | Exceptional 17.2% |