Swiss vs Immigrants from Uganda 11th Grade
COMPARE
Swiss
Immigrants from Uganda
11th Grade
11th Grade Comparison
Swiss
Immigrants from Uganda
93.6%
11TH GRADE
99.0/ 100
METRIC RATING
94th/ 347
METRIC RANK
92.3%
11TH GRADE
25.2/ 100
METRIC RATING
199th/ 347
METRIC RANK
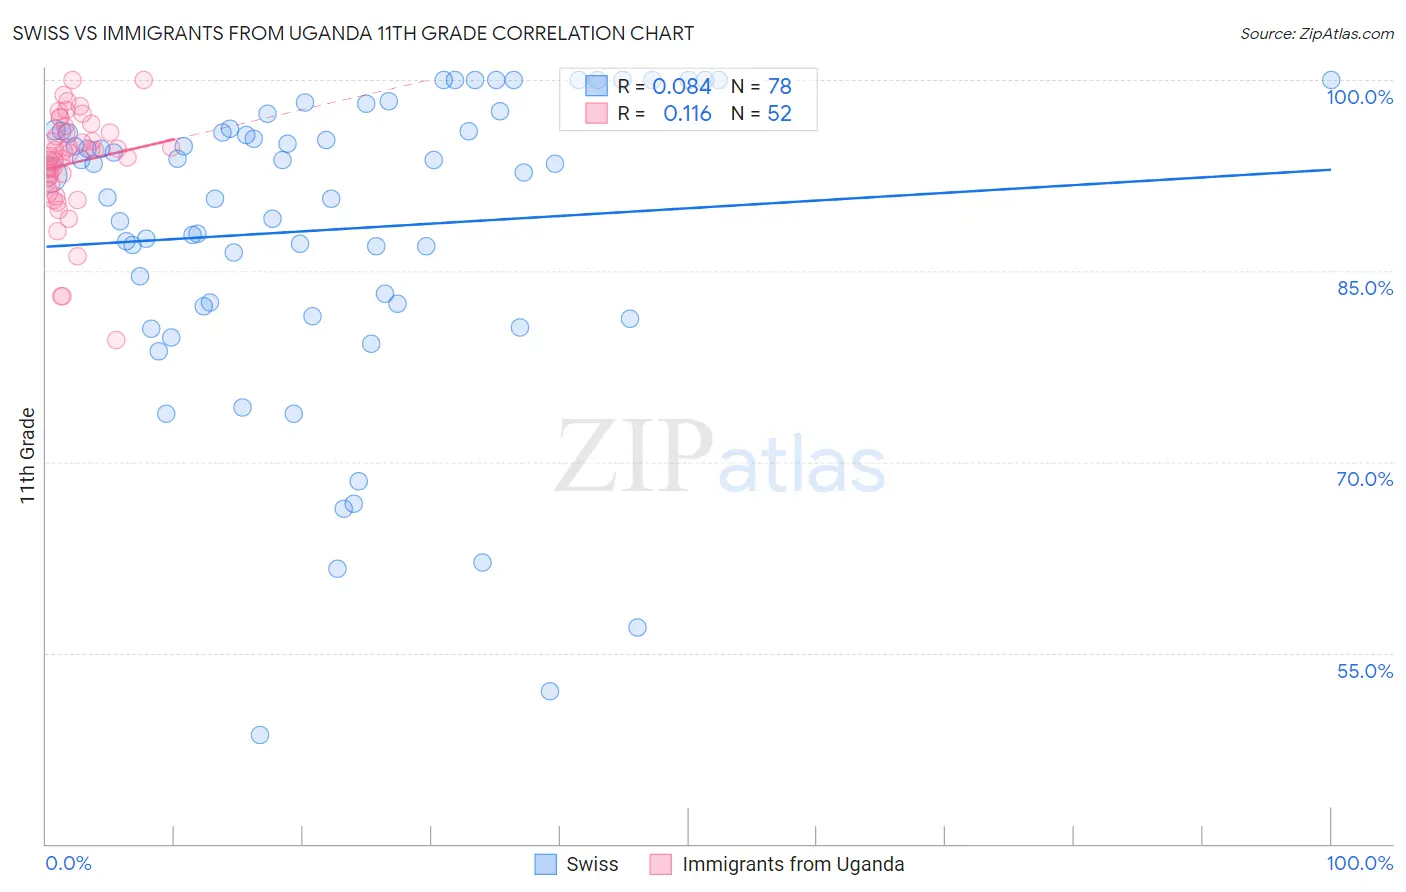
Swiss vs Immigrants from Uganda 11th Grade Correlation Chart
The statistical analysis conducted on geographies consisting of 465,022,572 people shows a slight positive correlation between the proportion of Swiss and percentage of population with at least 11th grade education in the United States with a correlation coefficient (R) of 0.084 and weighted average of 93.6%. Similarly, the statistical analysis conducted on geographies consisting of 125,969,169 people shows a poor positive correlation between the proportion of Immigrants from Uganda and percentage of population with at least 11th grade education in the United States with a correlation coefficient (R) of 0.116 and weighted average of 92.3%, a difference of 1.4%.
11th Grade Correlation Summary
| Measurement | Swiss | Immigrants from Uganda |
| Minimum | 48.5% | 79.6% |
| Maximum | 100.0% | 100.0% |
| Range | 51.5% | 20.4% |
| Mean | 88.2% | 93.5% |
| Median | 93.0% | 94.2% |
| Interquartile 25% (IQ1) | 82.4% | 92.0% |
| Interquartile 75% (IQ3) | 96.1% | 95.9% |
| Interquartile Range (IQR) | 13.7% | 3.8% |
| Standard Deviation (Sample) | 12.0% | 4.1% |
| Standard Deviation (Population) | 11.9% | 4.1% |
Similar Demographics by 11th Grade
Demographics Similar to Swiss by 11th Grade
In terms of 11th grade, the demographic groups most similar to Swiss are Immigrants from France (93.6%, a difference of 0.0%), Puget Sound Salish (93.6%, a difference of 0.020%), Immigrants from Turkey (93.5%, a difference of 0.020%), Immigrants from Iran (93.5%, a difference of 0.030%), and South African (93.6%, a difference of 0.040%).
| Demographics | Rating | Rank | 11th Grade |
| Immigrants | Western Europe | 99.2 /100 | #87 | Exceptional 93.6% |
| Cambodians | 99.2 /100 | #88 | Exceptional 93.6% |
| Burmese | 99.2 /100 | #89 | Exceptional 93.6% |
| Ottawa | 99.2 /100 | #90 | Exceptional 93.6% |
| South Africans | 99.2 /100 | #91 | Exceptional 93.6% |
| Immigrants | Bulgaria | 99.1 /100 | #92 | Exceptional 93.6% |
| Puget Sound Salish | 99.1 /100 | #93 | Exceptional 93.6% |
| Swiss | 99.0 /100 | #94 | Exceptional 93.6% |
| Immigrants | France | 99.0 /100 | #95 | Exceptional 93.6% |
| Immigrants | Turkey | 98.9 /100 | #96 | Exceptional 93.5% |
| Immigrants | Iran | 98.9 /100 | #97 | Exceptional 93.5% |
| Immigrants | Israel | 98.8 /100 | #98 | Exceptional 93.5% |
| Menominee | 98.7 /100 | #99 | Exceptional 93.5% |
| Immigrants | North Macedonia | 98.7 /100 | #100 | Exceptional 93.5% |
| Immigrants | Romania | 98.7 /100 | #101 | Exceptional 93.5% |
Demographics Similar to Immigrants from Uganda by 11th Grade
In terms of 11th grade, the demographic groups most similar to Immigrants from Uganda are Hawaiian (92.3%, a difference of 0.0%), Samoan (92.3%, a difference of 0.0%), Immigrants from China (92.3%, a difference of 0.0%), Marshallese (92.3%, a difference of 0.010%), and Liberian (92.3%, a difference of 0.020%).
| Demographics | Rating | Rank | 11th Grade |
| Immigrants | Syria | 30.4 /100 | #192 | Fair 92.3% |
| Moroccans | 28.7 /100 | #193 | Fair 92.3% |
| Sioux | 28.5 /100 | #194 | Fair 92.3% |
| Liberians | 26.8 /100 | #195 | Fair 92.3% |
| Panamanians | 26.4 /100 | #196 | Fair 92.3% |
| Marshallese | 26.0 /100 | #197 | Fair 92.3% |
| Hawaiians | 25.5 /100 | #198 | Fair 92.3% |
| Immigrants | Uganda | 25.2 /100 | #199 | Fair 92.3% |
| Samoans | 25.1 /100 | #200 | Fair 92.3% |
| Immigrants | China | 25.1 /100 | #201 | Fair 92.3% |
| Immigrants | Eastern Africa | 24.1 /100 | #202 | Fair 92.3% |
| Immigrants | Sudan | 23.5 /100 | #203 | Fair 92.3% |
| Immigrants | Hong Kong | 23.3 /100 | #204 | Fair 92.2% |
| Kiowa | 23.2 /100 | #205 | Fair 92.2% |
| Bolivians | 23.2 /100 | #206 | Fair 92.2% |