Swiss vs Immigrants from Barbados 11th Grade
COMPARE
Swiss
Immigrants from Barbados
11th Grade
11th Grade Comparison
Swiss
Immigrants from Barbados
93.6%
11TH GRADE
99.0/ 100
METRIC RATING
94th/ 347
METRIC RANK
90.7%
11TH GRADE
0.0/ 100
METRIC RATING
283rd/ 347
METRIC RANK
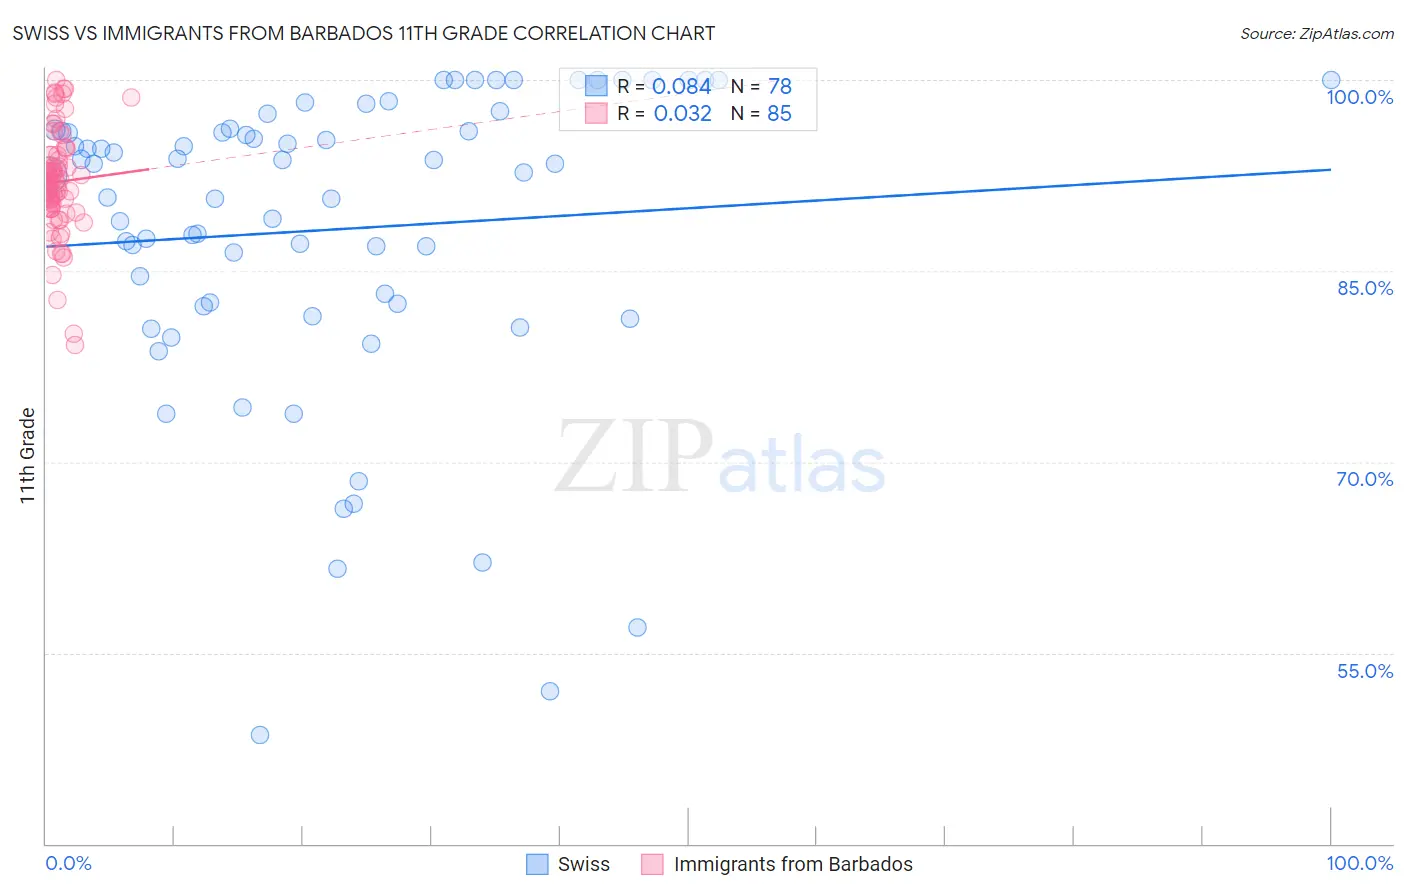
Swiss vs Immigrants from Barbados 11th Grade Correlation Chart
The statistical analysis conducted on geographies consisting of 465,022,572 people shows a slight positive correlation between the proportion of Swiss and percentage of population with at least 11th grade education in the United States with a correlation coefficient (R) of 0.084 and weighted average of 93.6%. Similarly, the statistical analysis conducted on geographies consisting of 112,782,130 people shows no correlation between the proportion of Immigrants from Barbados and percentage of population with at least 11th grade education in the United States with a correlation coefficient (R) of 0.032 and weighted average of 90.7%, a difference of 3.2%.
11th Grade Correlation Summary
| Measurement | Swiss | Immigrants from Barbados |
| Minimum | 48.5% | 79.2% |
| Maximum | 100.0% | 100.0% |
| Range | 51.5% | 20.8% |
| Mean | 88.2% | 92.0% |
| Median | 93.0% | 92.0% |
| Interquartile 25% (IQ1) | 82.4% | 90.0% |
| Interquartile 75% (IQ3) | 96.1% | 94.1% |
| Interquartile Range (IQR) | 13.7% | 4.1% |
| Standard Deviation (Sample) | 12.0% | 4.0% |
| Standard Deviation (Population) | 11.9% | 4.0% |
Similar Demographics by 11th Grade
Demographics Similar to Swiss by 11th Grade
In terms of 11th grade, the demographic groups most similar to Swiss are Immigrants from France (93.6%, a difference of 0.0%), Puget Sound Salish (93.6%, a difference of 0.020%), Immigrants from Turkey (93.5%, a difference of 0.020%), Immigrants from Iran (93.5%, a difference of 0.030%), and South African (93.6%, a difference of 0.040%).
| Demographics | Rating | Rank | 11th Grade |
| Immigrants | Western Europe | 99.2 /100 | #87 | Exceptional 93.6% |
| Cambodians | 99.2 /100 | #88 | Exceptional 93.6% |
| Burmese | 99.2 /100 | #89 | Exceptional 93.6% |
| Ottawa | 99.2 /100 | #90 | Exceptional 93.6% |
| South Africans | 99.2 /100 | #91 | Exceptional 93.6% |
| Immigrants | Bulgaria | 99.1 /100 | #92 | Exceptional 93.6% |
| Puget Sound Salish | 99.1 /100 | #93 | Exceptional 93.6% |
| Swiss | 99.0 /100 | #94 | Exceptional 93.6% |
| Immigrants | France | 99.0 /100 | #95 | Exceptional 93.6% |
| Immigrants | Turkey | 98.9 /100 | #96 | Exceptional 93.5% |
| Immigrants | Iran | 98.9 /100 | #97 | Exceptional 93.5% |
| Immigrants | Israel | 98.8 /100 | #98 | Exceptional 93.5% |
| Menominee | 98.7 /100 | #99 | Exceptional 93.5% |
| Immigrants | North Macedonia | 98.7 /100 | #100 | Exceptional 93.5% |
| Immigrants | Romania | 98.7 /100 | #101 | Exceptional 93.5% |
Demographics Similar to Immigrants from Barbados by 11th Grade
In terms of 11th grade, the demographic groups most similar to Immigrants from Barbados are Immigrants from St. Vincent and the Grenadines (90.7%, a difference of 0.010%), Dutch West Indian (90.7%, a difference of 0.020%), Sri Lankan (90.7%, a difference of 0.070%), Barbadian (90.8%, a difference of 0.14%), and Immigrants from Laos (90.5%, a difference of 0.17%).
| Demographics | Rating | Rank | 11th Grade |
| Bangladeshis | 0.1 /100 | #276 | Tragic 90.9% |
| Immigrants | Congo | 0.1 /100 | #277 | Tragic 90.9% |
| Malaysians | 0.1 /100 | #278 | Tragic 90.8% |
| Barbadians | 0.0 /100 | #279 | Tragic 90.8% |
| Sri Lankans | 0.0 /100 | #280 | Tragic 90.7% |
| Dutch West Indians | 0.0 /100 | #281 | Tragic 90.7% |
| Immigrants | St. Vincent and the Grenadines | 0.0 /100 | #282 | Tragic 90.7% |
| Immigrants | Barbados | 0.0 /100 | #283 | Tragic 90.7% |
| Immigrants | Laos | 0.0 /100 | #284 | Tragic 90.5% |
| Immigrants | Burma/Myanmar | 0.0 /100 | #285 | Tragic 90.4% |
| Immigrants | West Indies | 0.0 /100 | #286 | Tragic 90.4% |
| Apache | 0.0 /100 | #287 | Tragic 90.4% |
| Pennsylvania Germans | 0.0 /100 | #288 | Tragic 90.3% |
| British West Indians | 0.0 /100 | #289 | Tragic 90.3% |
| Indonesians | 0.0 /100 | #290 | Tragic 90.3% |