Swiss vs Immigrants from Eastern Africa 11th Grade
COMPARE
Swiss
Immigrants from Eastern Africa
11th Grade
11th Grade Comparison
Swiss
Immigrants from Eastern Africa
93.6%
11TH GRADE
99.0/ 100
METRIC RATING
94th/ 347
METRIC RANK
92.3%
11TH GRADE
24.1/ 100
METRIC RATING
202nd/ 347
METRIC RANK
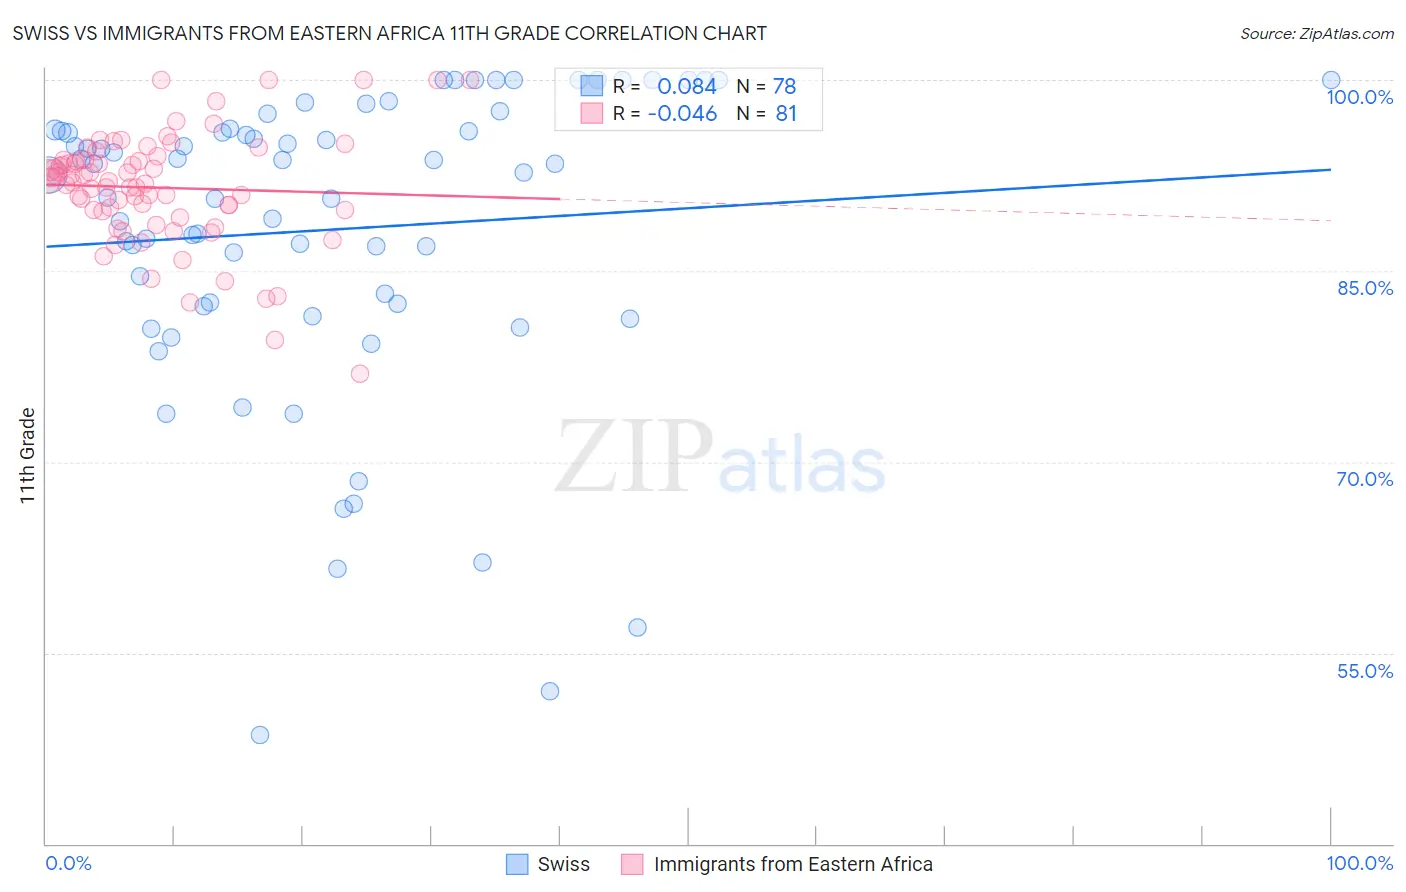
Swiss vs Immigrants from Eastern Africa 11th Grade Correlation Chart
The statistical analysis conducted on geographies consisting of 465,022,572 people shows a slight positive correlation between the proportion of Swiss and percentage of population with at least 11th grade education in the United States with a correlation coefficient (R) of 0.084 and weighted average of 93.6%. Similarly, the statistical analysis conducted on geographies consisting of 355,144,184 people shows no correlation between the proportion of Immigrants from Eastern Africa and percentage of population with at least 11th grade education in the United States with a correlation coefficient (R) of -0.046 and weighted average of 92.3%, a difference of 1.4%.
11th Grade Correlation Summary
| Measurement | Swiss | Immigrants from Eastern Africa |
| Minimum | 48.5% | 76.9% |
| Maximum | 100.0% | 100.0% |
| Range | 51.5% | 23.1% |
| Mean | 88.2% | 91.5% |
| Median | 93.0% | 92.1% |
| Interquartile 25% (IQ1) | 82.4% | 89.7% |
| Interquartile 75% (IQ3) | 96.1% | 93.7% |
| Interquartile Range (IQR) | 13.7% | 4.0% |
| Standard Deviation (Sample) | 12.0% | 4.4% |
| Standard Deviation (Population) | 11.9% | 4.4% |
Similar Demographics by 11th Grade
Demographics Similar to Swiss by 11th Grade
In terms of 11th grade, the demographic groups most similar to Swiss are Immigrants from France (93.6%, a difference of 0.0%), Puget Sound Salish (93.6%, a difference of 0.020%), Immigrants from Turkey (93.5%, a difference of 0.020%), Immigrants from Iran (93.5%, a difference of 0.030%), and South African (93.6%, a difference of 0.040%).
| Demographics | Rating | Rank | 11th Grade |
| Immigrants | Western Europe | 99.2 /100 | #87 | Exceptional 93.6% |
| Cambodians | 99.2 /100 | #88 | Exceptional 93.6% |
| Burmese | 99.2 /100 | #89 | Exceptional 93.6% |
| Ottawa | 99.2 /100 | #90 | Exceptional 93.6% |
| South Africans | 99.2 /100 | #91 | Exceptional 93.6% |
| Immigrants | Bulgaria | 99.1 /100 | #92 | Exceptional 93.6% |
| Puget Sound Salish | 99.1 /100 | #93 | Exceptional 93.6% |
| Swiss | 99.0 /100 | #94 | Exceptional 93.6% |
| Immigrants | France | 99.0 /100 | #95 | Exceptional 93.6% |
| Immigrants | Turkey | 98.9 /100 | #96 | Exceptional 93.5% |
| Immigrants | Iran | 98.9 /100 | #97 | Exceptional 93.5% |
| Immigrants | Israel | 98.8 /100 | #98 | Exceptional 93.5% |
| Menominee | 98.7 /100 | #99 | Exceptional 93.5% |
| Immigrants | North Macedonia | 98.7 /100 | #100 | Exceptional 93.5% |
| Immigrants | Romania | 98.7 /100 | #101 | Exceptional 93.5% |
Demographics Similar to Immigrants from Eastern Africa by 11th Grade
In terms of 11th grade, the demographic groups most similar to Immigrants from Eastern Africa are Samoan (92.3%, a difference of 0.010%), Immigrants from China (92.3%, a difference of 0.010%), Immigrants from Sudan (92.3%, a difference of 0.010%), Immigrants from Hong Kong (92.2%, a difference of 0.010%), and Kiowa (92.2%, a difference of 0.010%).
| Demographics | Rating | Rank | 11th Grade |
| Liberians | 26.8 /100 | #195 | Fair 92.3% |
| Panamanians | 26.4 /100 | #196 | Fair 92.3% |
| Marshallese | 26.0 /100 | #197 | Fair 92.3% |
| Hawaiians | 25.5 /100 | #198 | Fair 92.3% |
| Immigrants | Uganda | 25.2 /100 | #199 | Fair 92.3% |
| Samoans | 25.1 /100 | #200 | Fair 92.3% |
| Immigrants | China | 25.1 /100 | #201 | Fair 92.3% |
| Immigrants | Eastern Africa | 24.1 /100 | #202 | Fair 92.3% |
| Immigrants | Sudan | 23.5 /100 | #203 | Fair 92.3% |
| Immigrants | Hong Kong | 23.3 /100 | #204 | Fair 92.2% |
| Kiowa | 23.2 /100 | #205 | Fair 92.2% |
| Bolivians | 23.2 /100 | #206 | Fair 92.2% |
| Immigrants | Oceania | 22.4 /100 | #207 | Fair 92.2% |
| Colville | 21.8 /100 | #208 | Fair 92.2% |
| Tongans | 19.8 /100 | #209 | Poor 92.2% |