Swiss vs Immigrants from Bosnia and Herzegovina 7th Grade
COMPARE
Swiss
Immigrants from Bosnia and Herzegovina
7th Grade
7th Grade Comparison
Swiss
Immigrants from Bosnia and Herzegovina
97.3%
7TH GRADE
100.0/ 100
METRIC RATING
35th/ 347
METRIC RANK
96.4%
7TH GRADE
93.3/ 100
METRIC RATING
127th/ 347
METRIC RANK
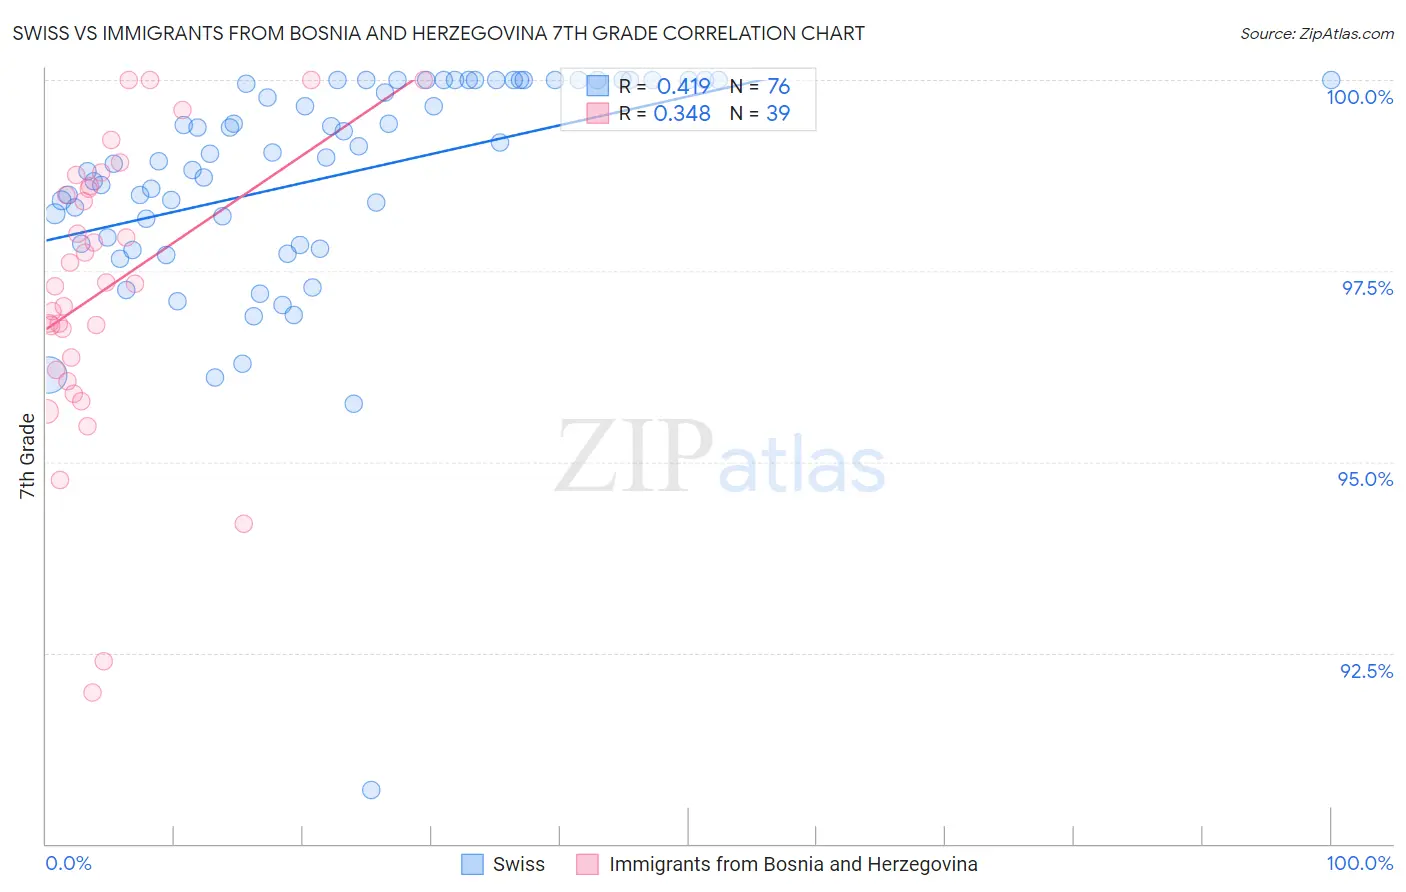
Swiss vs Immigrants from Bosnia and Herzegovina 7th Grade Correlation Chart
The statistical analysis conducted on geographies consisting of 465,021,856 people shows a moderate positive correlation between the proportion of Swiss and percentage of population with at least 7th grade education in the United States with a correlation coefficient (R) of 0.419 and weighted average of 97.3%. Similarly, the statistical analysis conducted on geographies consisting of 156,779,463 people shows a mild positive correlation between the proportion of Immigrants from Bosnia and Herzegovina and percentage of population with at least 7th grade education in the United States with a correlation coefficient (R) of 0.348 and weighted average of 96.4%, a difference of 0.87%.
7th Grade Correlation Summary
| Measurement | Swiss | Immigrants from Bosnia and Herzegovina |
| Minimum | 90.7% | 92.0% |
| Maximum | 100.0% | 100.0% |
| Range | 9.3% | 8.0% |
| Mean | 98.7% | 97.3% |
| Median | 99.0% | 97.3% |
| Interquartile 25% (IQ1) | 97.9% | 96.2% |
| Interquartile 75% (IQ3) | 100.0% | 98.6% |
| Interquartile Range (IQR) | 2.1% | 2.4% |
| Standard Deviation (Sample) | 1.5% | 1.9% |
| Standard Deviation (Population) | 1.5% | 1.9% |
Similar Demographics by 7th Grade
Demographics Similar to Swiss by 7th Grade
In terms of 7th grade, the demographic groups most similar to Swiss are Alaska Native (97.3%, a difference of 0.030%), Hungarian (97.2%, a difference of 0.040%), British (97.2%, a difference of 0.050%), Chippewa (97.3%, a difference of 0.060%), and Belgian (97.2%, a difference of 0.060%).
| Demographics | Rating | Rank | 7th Grade |
| Sioux | 100.0 /100 | #28 | Exceptional 97.4% |
| Scandinavians | 100.0 /100 | #29 | Exceptional 97.4% |
| Czechs | 100.0 /100 | #30 | Exceptional 97.4% |
| Europeans | 100.0 /100 | #31 | Exceptional 97.3% |
| Italians | 100.0 /100 | #32 | Exceptional 97.3% |
| Chippewa | 100.0 /100 | #33 | Exceptional 97.3% |
| Alaska Natives | 100.0 /100 | #34 | Exceptional 97.3% |
| Swiss | 100.0 /100 | #35 | Exceptional 97.3% |
| Hungarians | 100.0 /100 | #36 | Exceptional 97.2% |
| British | 100.0 /100 | #37 | Exceptional 97.2% |
| Belgians | 100.0 /100 | #38 | Exceptional 97.2% |
| Latvians | 100.0 /100 | #39 | Exceptional 97.2% |
| Luxembourgers | 100.0 /100 | #40 | Exceptional 97.2% |
| Eastern Europeans | 100.0 /100 | #41 | Exceptional 97.2% |
| Chinese | 99.9 /100 | #42 | Exceptional 97.1% |
Demographics Similar to Immigrants from Bosnia and Herzegovina by 7th Grade
In terms of 7th grade, the demographic groups most similar to Immigrants from Bosnia and Herzegovina are Palestinian (96.4%, a difference of 0.0%), Immigrants from Romania (96.4%, a difference of 0.0%), Immigrants from North Macedonia (96.4%, a difference of 0.010%), Immigrants from Serbia (96.4%, a difference of 0.010%), and Immigrants from Bulgaria (96.4%, a difference of 0.020%).
| Demographics | Rating | Rank | 7th Grade |
| Immigrants | Croatia | 95.0 /100 | #120 | Exceptional 96.5% |
| Cheyenne | 94.9 /100 | #121 | Exceptional 96.5% |
| Immigrants | Europe | 94.8 /100 | #122 | Exceptional 96.5% |
| Immigrants | France | 94.7 /100 | #123 | Exceptional 96.5% |
| Immigrants | Switzerland | 94.5 /100 | #124 | Exceptional 96.5% |
| Immigrants | Bulgaria | 94.0 /100 | #125 | Exceptional 96.4% |
| Palestinians | 93.5 /100 | #126 | Exceptional 96.4% |
| Immigrants | Bosnia and Herzegovina | 93.3 /100 | #127 | Exceptional 96.4% |
| Immigrants | Romania | 93.2 /100 | #128 | Exceptional 96.4% |
| Immigrants | North Macedonia | 93.1 /100 | #129 | Exceptional 96.4% |
| Immigrants | Serbia | 92.8 /100 | #130 | Exceptional 96.4% |
| Filipinos | 92.1 /100 | #131 | Exceptional 96.4% |
| Colville | 91.7 /100 | #132 | Exceptional 96.4% |
| Hmong | 91.5 /100 | #133 | Exceptional 96.4% |
| Soviet Union | 91.2 /100 | #134 | Exceptional 96.4% |