Brazilian vs Immigrants from Guatemala 7th Grade
COMPARE
Brazilian
Immigrants from Guatemala
7th Grade
7th Grade Comparison
Brazilians
Immigrants from Guatemala
96.0%
7TH GRADE
37.3/ 100
METRIC RATING
185th/ 347
METRIC RANK
91.3%
7TH GRADE
0.0/ 100
METRIC RATING
343rd/ 347
METRIC RANK
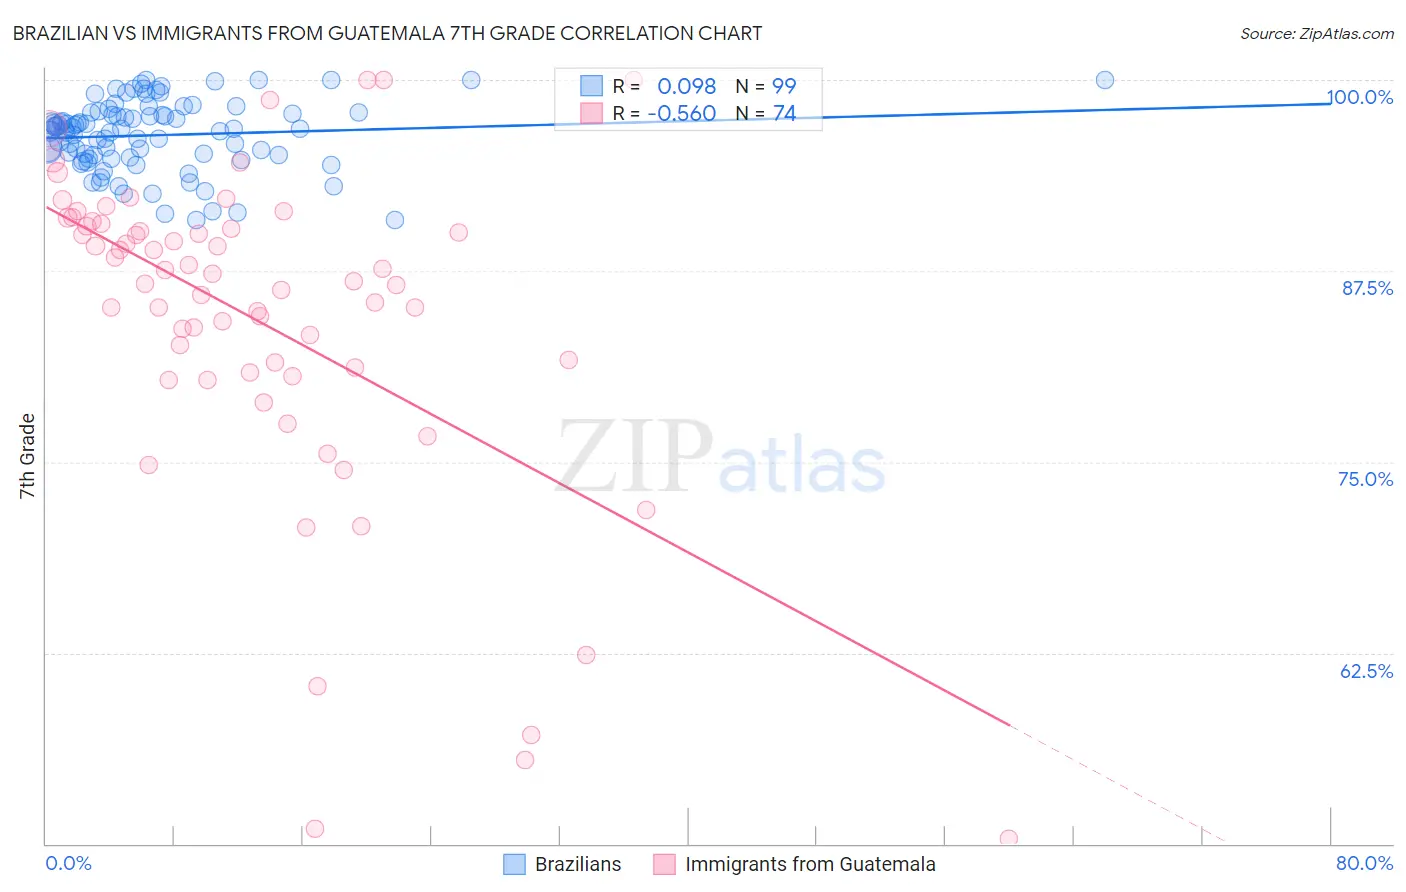
Brazilian vs Immigrants from Guatemala 7th Grade Correlation Chart
The statistical analysis conducted on geographies consisting of 323,962,626 people shows a slight positive correlation between the proportion of Brazilians and percentage of population with at least 7th grade education in the United States with a correlation coefficient (R) of 0.098 and weighted average of 96.0%. Similarly, the statistical analysis conducted on geographies consisting of 377,286,142 people shows a substantial negative correlation between the proportion of Immigrants from Guatemala and percentage of population with at least 7th grade education in the United States with a correlation coefficient (R) of -0.560 and weighted average of 91.3%, a difference of 5.1%.
7th Grade Correlation Summary
| Measurement | Brazilian | Immigrants from Guatemala |
| Minimum | 90.8% | 50.3% |
| Maximum | 100.0% | 100.0% |
| Range | 9.2% | 49.7% |
| Mean | 96.4% | 84.2% |
| Median | 96.8% | 86.7% |
| Interquartile 25% (IQ1) | 94.9% | 80.8% |
| Interquartile 75% (IQ3) | 97.8% | 90.5% |
| Interquartile Range (IQR) | 2.9% | 9.6% |
| Standard Deviation (Sample) | 2.3% | 10.7% |
| Standard Deviation (Population) | 2.3% | 10.6% |
Similar Demographics by 7th Grade
Demographics Similar to Brazilians by 7th Grade
In terms of 7th grade, the demographic groups most similar to Brazilians are Sierra Leonean (96.0%, a difference of 0.0%), Immigrants from Spain (96.0%, a difference of 0.010%), Immigrants from Iraq (96.0%, a difference of 0.010%), Immigrants from Uganda (96.0%, a difference of 0.010%), and Immigrants from Egypt (95.9%, a difference of 0.020%).
| Demographics | Rating | Rank | 7th Grade |
| Marshallese | 48.4 /100 | #178 | Average 96.0% |
| Immigrants | Iran | 47.8 /100 | #179 | Average 96.0% |
| Immigrants | Brazil | 46.8 /100 | #180 | Average 96.0% |
| Pakistanis | 44.5 /100 | #181 | Average 96.0% |
| Iraqis | 41.2 /100 | #182 | Average 96.0% |
| Immigrants | Spain | 38.8 /100 | #183 | Fair 96.0% |
| Sierra Leoneans | 37.5 /100 | #184 | Fair 96.0% |
| Brazilians | 37.3 /100 | #185 | Fair 96.0% |
| Immigrants | Iraq | 36.1 /100 | #186 | Fair 96.0% |
| Immigrants | Uganda | 36.0 /100 | #187 | Fair 96.0% |
| Immigrants | Egypt | 34.3 /100 | #188 | Fair 95.9% |
| Immigrants | Venezuela | 33.9 /100 | #189 | Fair 95.9% |
| Immigrants | Micronesia | 32.6 /100 | #190 | Fair 95.9% |
| Liberians | 32.5 /100 | #191 | Fair 95.9% |
| Panamanians | 32.3 /100 | #192 | Fair 95.9% |
Demographics Similar to Immigrants from Guatemala by 7th Grade
In terms of 7th grade, the demographic groups most similar to Immigrants from Guatemala are Salvadoran (91.5%, a difference of 0.16%), Immigrants from Central America (91.0%, a difference of 0.36%), Guatemalan (91.7%, a difference of 0.43%), Immigrants from El Salvador (90.9%, a difference of 0.43%), and Yakama (91.7%, a difference of 0.45%).
| Demographics | Rating | Rank | 7th Grade |
| Immigrants | Armenia | 0.0 /100 | #333 | Tragic 92.7% |
| Immigrants | Yemen | 0.0 /100 | #334 | Tragic 92.6% |
| Mexican American Indians | 0.0 /100 | #335 | Tragic 92.6% |
| Immigrants | Honduras | 0.0 /100 | #336 | Tragic 92.5% |
| Immigrants | Latin America | 0.0 /100 | #337 | Tragic 92.2% |
| Central Americans | 0.0 /100 | #338 | Tragic 92.1% |
| Mexicans | 0.0 /100 | #339 | Tragic 91.9% |
| Yakama | 0.0 /100 | #340 | Tragic 91.7% |
| Guatemalans | 0.0 /100 | #341 | Tragic 91.7% |
| Salvadorans | 0.0 /100 | #342 | Tragic 91.5% |
| Immigrants | Guatemala | 0.0 /100 | #343 | Tragic 91.3% |
| Immigrants | Central America | 0.0 /100 | #344 | Tragic 91.0% |
| Immigrants | El Salvador | 0.0 /100 | #345 | Tragic 90.9% |
| Immigrants | Mexico | 0.0 /100 | #346 | Tragic 90.7% |
| Spanish American Indians | 0.0 /100 | #347 | Tragic 90.3% |