Swiss vs Immigrants from Eastern Africa Female Poverty Among 18-24 Year Olds
COMPARE
Swiss
Immigrants from Eastern Africa
Female Poverty Among 18-24 Year Olds
Female Poverty Among 18-24 Year Olds Comparison
Swiss
Immigrants from Eastern Africa
20.2%
FEMALE POVERTY AMONG 18-24 YEAR OLDS
44.0/ 100
METRIC RATING
178th/ 347
METRIC RANK
21.4%
FEMALE POVERTY AMONG 18-24 YEAR OLDS
0.4/ 100
METRIC RATING
262nd/ 347
METRIC RANK
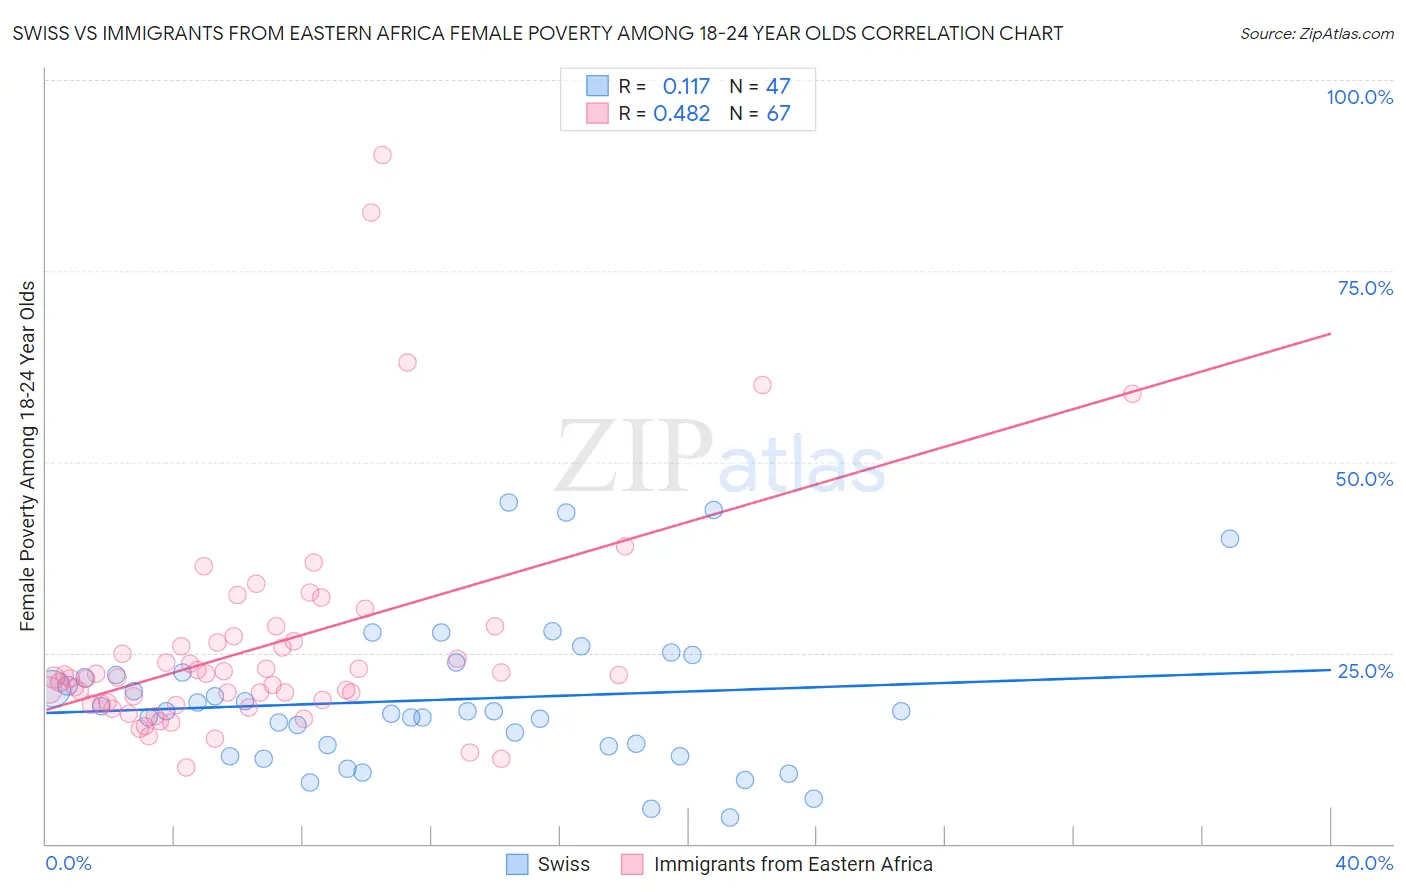
Swiss vs Immigrants from Eastern Africa Female Poverty Among 18-24 Year Olds Correlation Chart
The statistical analysis conducted on geographies consisting of 446,334,807 people shows a poor positive correlation between the proportion of Swiss and poverty level among females between the ages 18 and 24 in the United States with a correlation coefficient (R) of 0.117 and weighted average of 20.2%. Similarly, the statistical analysis conducted on geographies consisting of 348,760,216 people shows a moderate positive correlation between the proportion of Immigrants from Eastern Africa and poverty level among females between the ages 18 and 24 in the United States with a correlation coefficient (R) of 0.482 and weighted average of 21.4%, a difference of 6.3%.
Female Poverty Among 18-24 Year Olds Correlation Summary
| Measurement | Swiss | Immigrants from Eastern Africa |
| Minimum | 3.4% | 10.0% |
| Maximum | 44.7% | 90.2% |
| Range | 41.3% | 80.3% |
| Mean | 18.8% | 25.8% |
| Median | 17.4% | 21.8% |
| Interquartile 25% (IQ1) | 12.8% | 18.4% |
| Interquartile 75% (IQ3) | 22.3% | 26.5% |
| Interquartile Range (IQR) | 9.6% | 8.1% |
| Standard Deviation (Sample) | 9.6% | 14.7% |
| Standard Deviation (Population) | 9.4% | 14.6% |
Similar Demographics by Female Poverty Among 18-24 Year Olds
Demographics Similar to Swiss by Female Poverty Among 18-24 Year Olds
In terms of female poverty among 18-24 year olds, the demographic groups most similar to Swiss are Immigrants from Kazakhstan (20.2%, a difference of 0.010%), Ethiopian (20.2%, a difference of 0.010%), Iraqi (20.2%, a difference of 0.030%), Kenyan (20.2%, a difference of 0.040%), and Immigrants from China (20.2%, a difference of 0.050%).
| Demographics | Rating | Rank | Female Poverty Among 18-24 Year Olds |
| Immigrants | Nigeria | 54.3 /100 | #171 | Average 20.1% |
| Belizeans | 52.0 /100 | #172 | Average 20.1% |
| Irish | 50.0 /100 | #173 | Average 20.1% |
| Swedes | 50.0 /100 | #174 | Average 20.1% |
| South American Indians | 48.4 /100 | #175 | Average 20.1% |
| Kenyans | 44.9 /100 | #176 | Average 20.2% |
| Immigrants | Kazakhstan | 44.2 /100 | #177 | Average 20.2% |
| Swiss | 44.0 /100 | #178 | Average 20.2% |
| Ethiopians | 43.8 /100 | #179 | Average 20.2% |
| Iraqis | 43.3 /100 | #180 | Average 20.2% |
| Immigrants | China | 43.0 /100 | #181 | Average 20.2% |
| Immigrants | Barbados | 42.8 /100 | #182 | Average 20.2% |
| Lebanese | 40.6 /100 | #183 | Average 20.2% |
| Immigrants | Central America | 39.9 /100 | #184 | Fair 20.2% |
| Nepalese | 39.7 /100 | #185 | Fair 20.2% |
Demographics Similar to Immigrants from Eastern Africa by Female Poverty Among 18-24 Year Olds
In terms of female poverty among 18-24 year olds, the demographic groups most similar to Immigrants from Eastern Africa are Immigrants from Bahamas (21.4%, a difference of 0.20%), Immigrants from Norway (21.4%, a difference of 0.26%), Immigrants from France (21.4%, a difference of 0.31%), Vietnamese (21.4%, a difference of 0.34%), and Icelander (21.5%, a difference of 0.35%).
| Demographics | Rating | Rank | Female Poverty Among 18-24 Year Olds |
| Immigrants | Grenada | 1.2 /100 | #255 | Tragic 21.2% |
| Tsimshian | 1.0 /100 | #256 | Tragic 21.2% |
| Taiwanese | 1.0 /100 | #257 | Tragic 21.2% |
| Vietnamese | 0.6 /100 | #258 | Tragic 21.4% |
| Immigrants | France | 0.6 /100 | #259 | Tragic 21.4% |
| Immigrants | Norway | 0.6 /100 | #260 | Tragic 21.4% |
| Immigrants | Bahamas | 0.5 /100 | #261 | Tragic 21.4% |
| Immigrants | Eastern Africa | 0.4 /100 | #262 | Tragic 21.4% |
| Icelanders | 0.3 /100 | #263 | Tragic 21.5% |
| Hondurans | 0.3 /100 | #264 | Tragic 21.5% |
| Immigrants | Nonimmigrants | 0.3 /100 | #265 | Tragic 21.5% |
| Alaska Natives | 0.3 /100 | #266 | Tragic 21.5% |
| Americans | 0.3 /100 | #267 | Tragic 21.6% |
| Immigrants | Burma/Myanmar | 0.2 /100 | #268 | Tragic 21.6% |
| Celtics | 0.2 /100 | #269 | Tragic 21.6% |