Swedish vs Immigrants from Singapore In Labor Force | Age > 16
COMPARE
Swedish
Immigrants from Singapore
In Labor Force | Age > 16
In Labor Force | Age > 16 Comparison
Swedes
Immigrants from Singapore
65.1%
IN LABOR FORCE | AGE > 16
47.4/ 100
METRIC RATING
176th/ 347
METRIC RANK
66.2%
IN LABOR FORCE | AGE > 16
99.7/ 100
METRIC RATING
75th/ 347
METRIC RANK
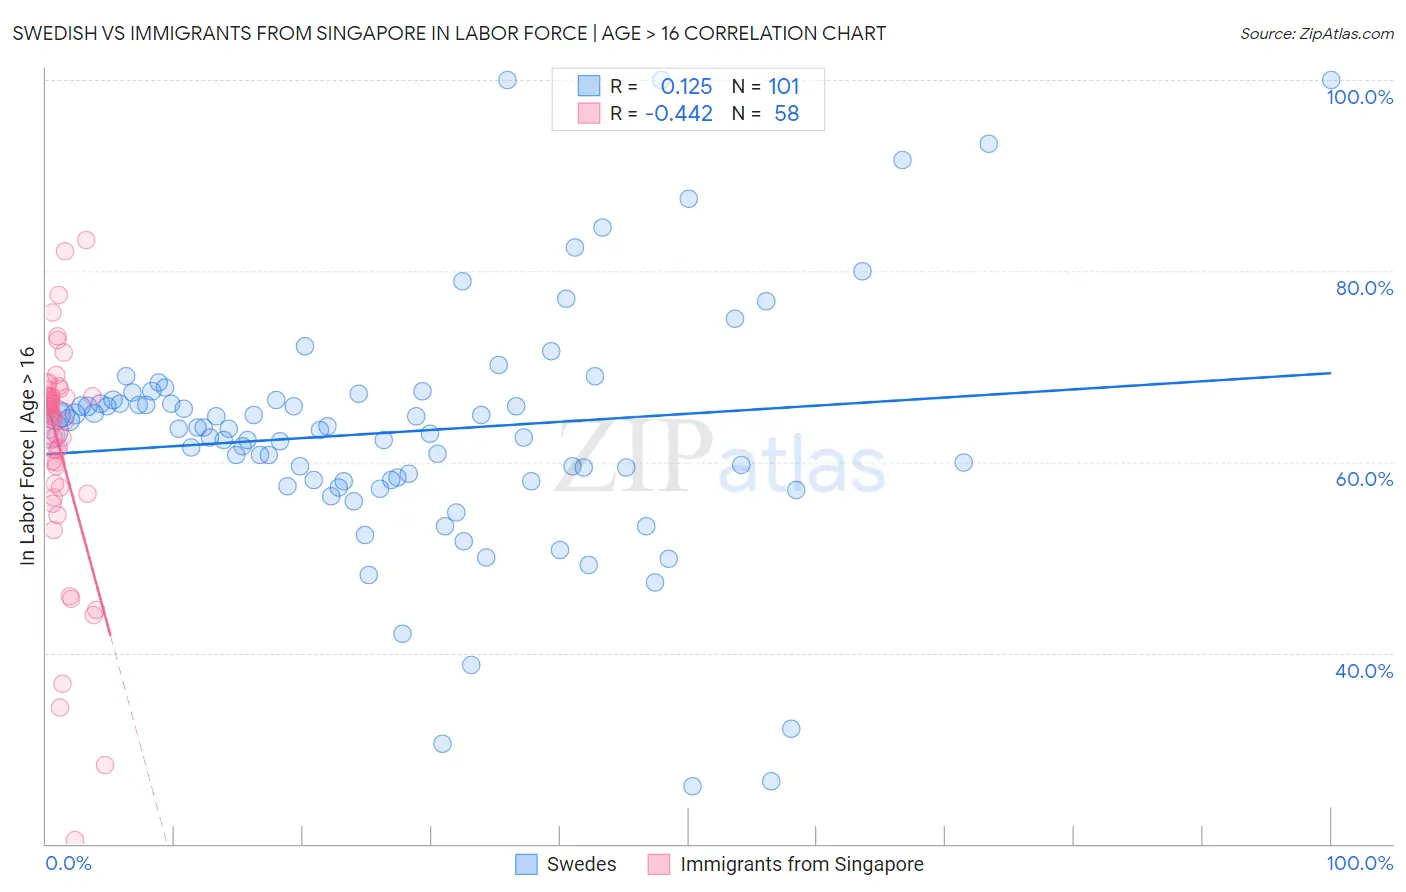
Swedish vs Immigrants from Singapore In Labor Force | Age > 16 Correlation Chart
The statistical analysis conducted on geographies consisting of 539,248,336 people shows a poor positive correlation between the proportion of Swedes and labor force participation rate among population ages 16 and over in the United States with a correlation coefficient (R) of 0.125 and weighted average of 65.1%. Similarly, the statistical analysis conducted on geographies consisting of 137,522,009 people shows a moderate negative correlation between the proportion of Immigrants from Singapore and labor force participation rate among population ages 16 and over in the United States with a correlation coefficient (R) of -0.442 and weighted average of 66.2%, a difference of 1.7%.
In Labor Force | Age > 16 Correlation Summary
| Measurement | Swedish | Immigrants from Singapore |
| Minimum | 26.0% | 20.4% |
| Maximum | 100.0% | 83.2% |
| Range | 74.0% | 62.8% |
| Mean | 63.1% | 61.5% |
| Median | 63.4% | 64.9% |
| Interquartile 25% (IQ1) | 58.0% | 57.8% |
| Interquartile 75% (IQ3) | 66.5% | 66.9% |
| Interquartile Range (IQR) | 8.5% | 9.1% |
| Standard Deviation (Sample) | 13.0% | 11.7% |
| Standard Deviation (Population) | 12.9% | 11.6% |
Similar Demographics by In Labor Force | Age > 16
Demographics Similar to Swedes by In Labor Force | Age > 16
In terms of in labor force | age > 16, the demographic groups most similar to Swedes are Eastern European (65.1%, a difference of 0.010%), Macedonian (65.1%, a difference of 0.030%), Nicaraguan (65.1%, a difference of 0.030%), Trinidadian and Tobagonian (65.1%, a difference of 0.030%), and Immigrants from Haiti (65.1%, a difference of 0.050%).
| Demographics | Rating | Rank | In Labor Force | Age > 16 |
| Arabs | 62.4 /100 | #169 | Good 65.2% |
| Immigrants | Israel | 61.7 /100 | #170 | Good 65.2% |
| Israelis | 61.6 /100 | #171 | Good 65.2% |
| Immigrants | Sweden | 61.3 /100 | #172 | Good 65.2% |
| Immigrants | Ukraine | 53.7 /100 | #173 | Average 65.1% |
| Macedonians | 50.0 /100 | #174 | Average 65.1% |
| Nicaraguans | 49.7 /100 | #175 | Average 65.1% |
| Swedes | 47.4 /100 | #176 | Average 65.1% |
| Eastern Europeans | 46.2 /100 | #177 | Average 65.1% |
| Trinidadians and Tobagonians | 45.2 /100 | #178 | Average 65.1% |
| Immigrants | Haiti | 43.3 /100 | #179 | Average 65.1% |
| Immigrants | Latvia | 42.9 /100 | #180 | Average 65.1% |
| Immigrants | Panama | 42.4 /100 | #181 | Average 65.1% |
| Immigrants | Nicaragua | 41.1 /100 | #182 | Average 65.1% |
| Soviet Union | 40.5 /100 | #183 | Average 65.0% |
Demographics Similar to Immigrants from Singapore by In Labor Force | Age > 16
In terms of in labor force | age > 16, the demographic groups most similar to Immigrants from Singapore are Immigrants from Vietnam (66.2%, a difference of 0.010%), Immigrants from Korea (66.2%, a difference of 0.010%), Burmese (66.2%, a difference of 0.020%), Taiwanese (66.2%, a difference of 0.020%), and Asian (66.2%, a difference of 0.040%).
| Demographics | Rating | Rank | In Labor Force | Age > 16 |
| Immigrants | Egypt | 99.7 /100 | #68 | Exceptional 66.2% |
| Sub-Saharan Africans | 99.7 /100 | #69 | Exceptional 66.2% |
| Asians | 99.7 /100 | #70 | Exceptional 66.2% |
| Burmese | 99.7 /100 | #71 | Exceptional 66.2% |
| Taiwanese | 99.7 /100 | #72 | Exceptional 66.2% |
| Immigrants | Vietnam | 99.7 /100 | #73 | Exceptional 66.2% |
| Immigrants | Korea | 99.7 /100 | #74 | Exceptional 66.2% |
| Immigrants | Singapore | 99.7 /100 | #75 | Exceptional 66.2% |
| Immigrants | Malaysia | 99.6 /100 | #76 | Exceptional 66.1% |
| Immigrants | Moldova | 99.6 /100 | #77 | Exceptional 66.1% |
| Immigrants | Asia | 99.6 /100 | #78 | Exceptional 66.1% |
| Turks | 99.6 /100 | #79 | Exceptional 66.1% |
| Malaysians | 99.6 /100 | #80 | Exceptional 66.1% |
| Moroccans | 99.5 /100 | #81 | Exceptional 66.1% |
| German Russians | 99.4 /100 | #82 | Exceptional 66.1% |