Burmese vs Immigrants from Singapore Doctorate Degree
COMPARE
Burmese
Immigrants from Singapore
Doctorate Degree
Doctorate Degree Comparison
Burmese
Immigrants from Singapore
2.6%
DOCTORATE DEGREE
100.0/ 100
METRIC RATING
28th/ 347
METRIC RANK
3.7%
DOCTORATE DEGREE
100.0/ 100
METRIC RATING
1st/ 347
METRIC RANK
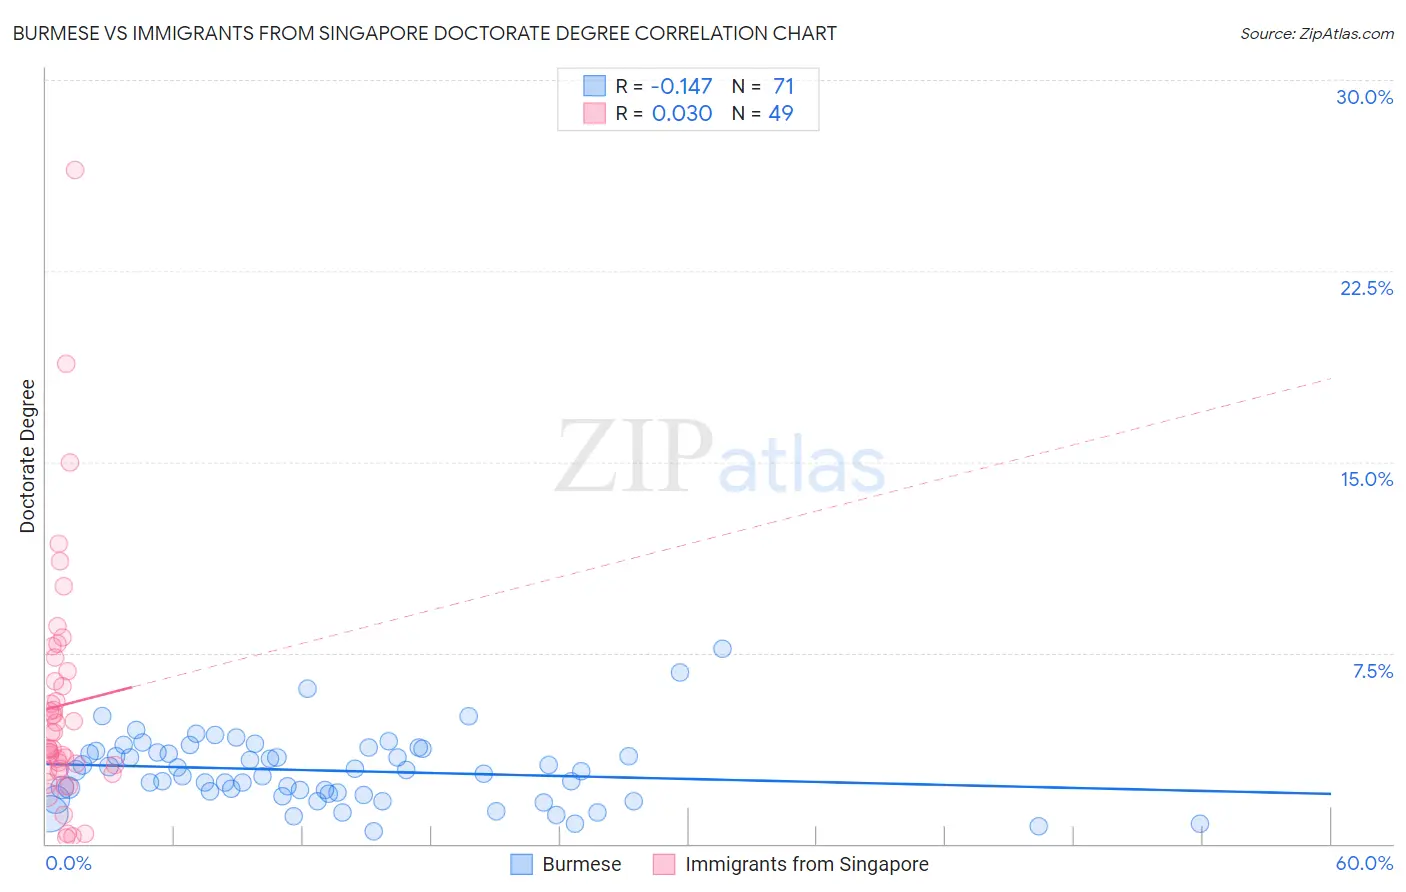
Burmese vs Immigrants from Singapore Doctorate Degree Correlation Chart
The statistical analysis conducted on geographies consisting of 459,661,532 people shows a poor negative correlation between the proportion of Burmese and percentage of population with at least doctorate degree education in the United States with a correlation coefficient (R) of -0.147 and weighted average of 2.6%. Similarly, the statistical analysis conducted on geographies consisting of 137,317,950 people shows no correlation between the proportion of Immigrants from Singapore and percentage of population with at least doctorate degree education in the United States with a correlation coefficient (R) of 0.030 and weighted average of 3.7%, a difference of 39.7%.
Doctorate Degree Correlation Summary
| Measurement | Burmese | Immigrants from Singapore |
| Minimum | 0.47% | 0.22% |
| Maximum | 7.7% | 26.5% |
| Range | 7.2% | 26.3% |
| Mean | 2.9% | 5.4% |
| Median | 2.9% | 3.7% |
| Interquartile 25% (IQ1) | 2.0% | 2.9% |
| Interquartile 75% (IQ3) | 3.6% | 6.6% |
| Interquartile Range (IQR) | 1.7% | 3.7% |
| Standard Deviation (Sample) | 1.4% | 4.8% |
| Standard Deviation (Population) | 1.3% | 4.7% |
Similar Demographics by Doctorate Degree
Demographics Similar to Burmese by Doctorate Degree
In terms of doctorate degree, the demographic groups most similar to Burmese are Immigrants from South Central Asia (2.6%, a difference of 0.26%), Immigrants from Turkey (2.6%, a difference of 0.30%), Immigrants from Korea (2.6%, a difference of 0.30%), Turkish (2.7%, a difference of 1.2%), and Immigrants from Saudi Arabia (2.7%, a difference of 1.7%).
| Demographics | Rating | Rank | Doctorate Degree |
| Thais | 100.0 /100 | #21 | Exceptional 2.8% |
| Mongolians | 100.0 /100 | #22 | Exceptional 2.8% |
| Immigrants | Denmark | 100.0 /100 | #23 | Exceptional 2.8% |
| Israelis | 100.0 /100 | #24 | Exceptional 2.7% |
| Immigrants | Saudi Arabia | 100.0 /100 | #25 | Exceptional 2.7% |
| Turks | 100.0 /100 | #26 | Exceptional 2.7% |
| Immigrants | Turkey | 100.0 /100 | #27 | Exceptional 2.6% |
| Burmese | 100.0 /100 | #28 | Exceptional 2.6% |
| Immigrants | South Central Asia | 100.0 /100 | #29 | Exceptional 2.6% |
| Immigrants | Korea | 100.0 /100 | #30 | Exceptional 2.6% |
| Latvians | 100.0 /100 | #31 | Exceptional 2.6% |
| Immigrants | Northern Europe | 100.0 /100 | #32 | Exceptional 2.6% |
| Cambodians | 100.0 /100 | #33 | Exceptional 2.6% |
| Cypriots | 100.0 /100 | #34 | Exceptional 2.6% |
| Immigrants | Malaysia | 100.0 /100 | #35 | Exceptional 2.6% |
Demographics Similar to Immigrants from Singapore by Doctorate Degree
In terms of doctorate degree, the demographic groups most similar to Immigrants from Singapore are Filipino (3.4%, a difference of 7.2%), Okinawan (3.3%, a difference of 12.2%), Immigrants from Taiwan (3.2%, a difference of 15.1%), Iranian (3.1%, a difference of 16.9%), and Immigrants from Switzerland (3.1%, a difference of 19.2%).
| Demographics | Rating | Rank | Doctorate Degree |
| Immigrants | Singapore | 100.0 /100 | #1 | Exceptional 3.7% |
| Filipinos | 100.0 /100 | #2 | Exceptional 3.4% |
| Okinawans | 100.0 /100 | #3 | Exceptional 3.3% |
| Immigrants | Taiwan | 100.0 /100 | #4 | Exceptional 3.2% |
| Iranians | 100.0 /100 | #5 | Exceptional 3.1% |
| Immigrants | Switzerland | 100.0 /100 | #6 | Exceptional 3.1% |
| Immigrants | China | 100.0 /100 | #7 | Exceptional 3.1% |
| Immigrants | Israel | 100.0 /100 | #8 | Exceptional 3.0% |
| Immigrants | Iran | 100.0 /100 | #9 | Exceptional 3.0% |
| Immigrants | Eastern Asia | 100.0 /100 | #10 | Exceptional 3.0% |
| Indians (Asian) | 100.0 /100 | #11 | Exceptional 2.9% |
| Immigrants | Belgium | 100.0 /100 | #12 | Exceptional 2.9% |
| Immigrants | Sweden | 100.0 /100 | #13 | Exceptional 2.9% |
| Immigrants | France | 100.0 /100 | #14 | Exceptional 2.9% |
| Immigrants | India | 100.0 /100 | #15 | Exceptional 2.8% |