Colombian vs Immigrants from Russia 11th Grade
COMPARE
Colombian
Immigrants from Russia
11th Grade
11th Grade Comparison
Colombians
Immigrants from Russia
91.7%
11TH GRADE
2.8/ 100
METRIC RATING
236th/ 347
METRIC RANK
93.3%
11TH GRADE
96.6/ 100
METRIC RATING
120th/ 347
METRIC RANK
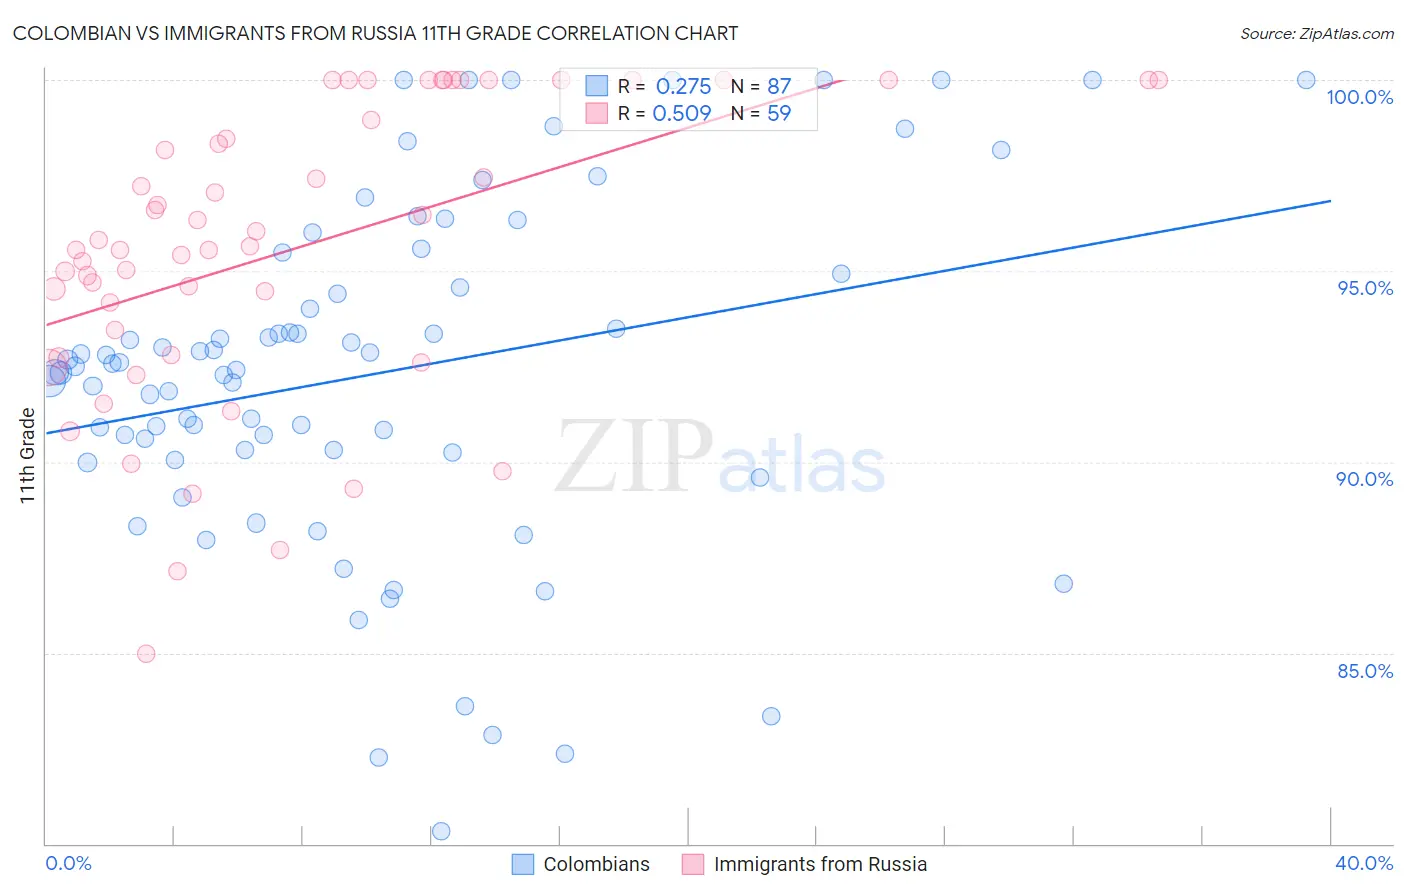
Colombian vs Immigrants from Russia 11th Grade Correlation Chart
The statistical analysis conducted on geographies consisting of 419,682,710 people shows a weak positive correlation between the proportion of Colombians and percentage of population with at least 11th grade education in the United States with a correlation coefficient (R) of 0.275 and weighted average of 91.7%. Similarly, the statistical analysis conducted on geographies consisting of 347,948,494 people shows a substantial positive correlation between the proportion of Immigrants from Russia and percentage of population with at least 11th grade education in the United States with a correlation coefficient (R) of 0.509 and weighted average of 93.3%, a difference of 1.7%.
11th Grade Correlation Summary
| Measurement | Colombian | Immigrants from Russia |
| Minimum | 80.3% | 85.0% |
| Maximum | 100.0% | 100.0% |
| Range | 19.7% | 15.0% |
| Mean | 92.3% | 95.6% |
| Median | 92.5% | 95.7% |
| Interquartile 25% (IQ1) | 90.3% | 92.8% |
| Interquartile 75% (IQ3) | 94.9% | 100.0% |
| Interquartile Range (IQR) | 4.7% | 7.2% |
| Standard Deviation (Sample) | 4.5% | 3.8% |
| Standard Deviation (Population) | 4.5% | 3.8% |
Similar Demographics by 11th Grade
Demographics Similar to Colombians by 11th Grade
In terms of 11th grade, the demographic groups most similar to Colombians are Subsaharan African (91.7%, a difference of 0.0%), Immigrants from Bolivia (91.7%, a difference of 0.0%), Armenian (91.7%, a difference of 0.010%), Comanche (91.7%, a difference of 0.020%), and Hopi (91.7%, a difference of 0.030%).
| Demographics | Rating | Rank | 11th Grade |
| Nigerians | 4.3 /100 | #229 | Tragic 91.8% |
| Immigrants | Afghanistan | 3.9 /100 | #230 | Tragic 91.8% |
| Choctaw | 3.7 /100 | #231 | Tragic 91.8% |
| Uruguayans | 3.5 /100 | #232 | Tragic 91.8% |
| Cheyenne | 3.3 /100 | #233 | Tragic 91.8% |
| Armenians | 2.9 /100 | #234 | Tragic 91.7% |
| Sub-Saharan Africans | 2.9 /100 | #235 | Tragic 91.7% |
| Colombians | 2.8 /100 | #236 | Tragic 91.7% |
| Immigrants | Bolivia | 2.8 /100 | #237 | Tragic 91.7% |
| Comanche | 2.6 /100 | #238 | Tragic 91.7% |
| Hopi | 2.5 /100 | #239 | Tragic 91.7% |
| South Americans | 2.0 /100 | #240 | Tragic 91.6% |
| Bahamians | 1.8 /100 | #241 | Tragic 91.6% |
| Immigrants | Middle Africa | 1.6 /100 | #242 | Tragic 91.6% |
| Immigrants | Thailand | 1.4 /100 | #243 | Tragic 91.6% |
Demographics Similar to Immigrants from Russia by 11th Grade
In terms of 11th grade, the demographic groups most similar to Immigrants from Russia are German Russian (93.3%, a difference of 0.020%), Immigrants from Belarus (93.3%, a difference of 0.020%), Immigrants from Korea (93.3%, a difference of 0.030%), Israeli (93.3%, a difference of 0.030%), and Immigrants from Greece (93.2%, a difference of 0.050%).
| Demographics | Rating | Rank | 11th Grade |
| Immigrants | Zimbabwe | 97.8 /100 | #113 | Exceptional 93.4% |
| Jordanians | 97.8 /100 | #114 | Exceptional 93.4% |
| Palestinians | 97.7 /100 | #115 | Exceptional 93.4% |
| Immigrants | Hungary | 97.5 /100 | #116 | Exceptional 93.4% |
| Whites/Caucasians | 97.4 /100 | #117 | Exceptional 93.3% |
| Immigrants | Korea | 97.0 /100 | #118 | Exceptional 93.3% |
| Israelis | 97.0 /100 | #119 | Exceptional 93.3% |
| Immigrants | Russia | 96.6 /100 | #120 | Exceptional 93.3% |
| German Russians | 96.4 /100 | #121 | Exceptional 93.3% |
| Immigrants | Belarus | 96.3 /100 | #122 | Exceptional 93.3% |
| Immigrants | Greece | 95.9 /100 | #123 | Exceptional 93.2% |
| Immigrants | Eastern Europe | 95.9 /100 | #124 | Exceptional 93.2% |
| Immigrants | Sri Lanka | 95.6 /100 | #125 | Exceptional 93.2% |
| Basques | 95.2 /100 | #126 | Exceptional 93.2% |
| Immigrants | Kazakhstan | 92.4 /100 | #127 | Exceptional 93.1% |