Swedish vs Liberian 8th Grade
COMPARE
Swedish
Liberian
8th Grade
8th Grade Comparison
Swedes
Liberians
97.4%
8TH GRADE
100.0/ 100
METRIC RATING
12th/ 347
METRIC RANK
95.6%
8TH GRADE
32.4/ 100
METRIC RATING
188th/ 347
METRIC RANK
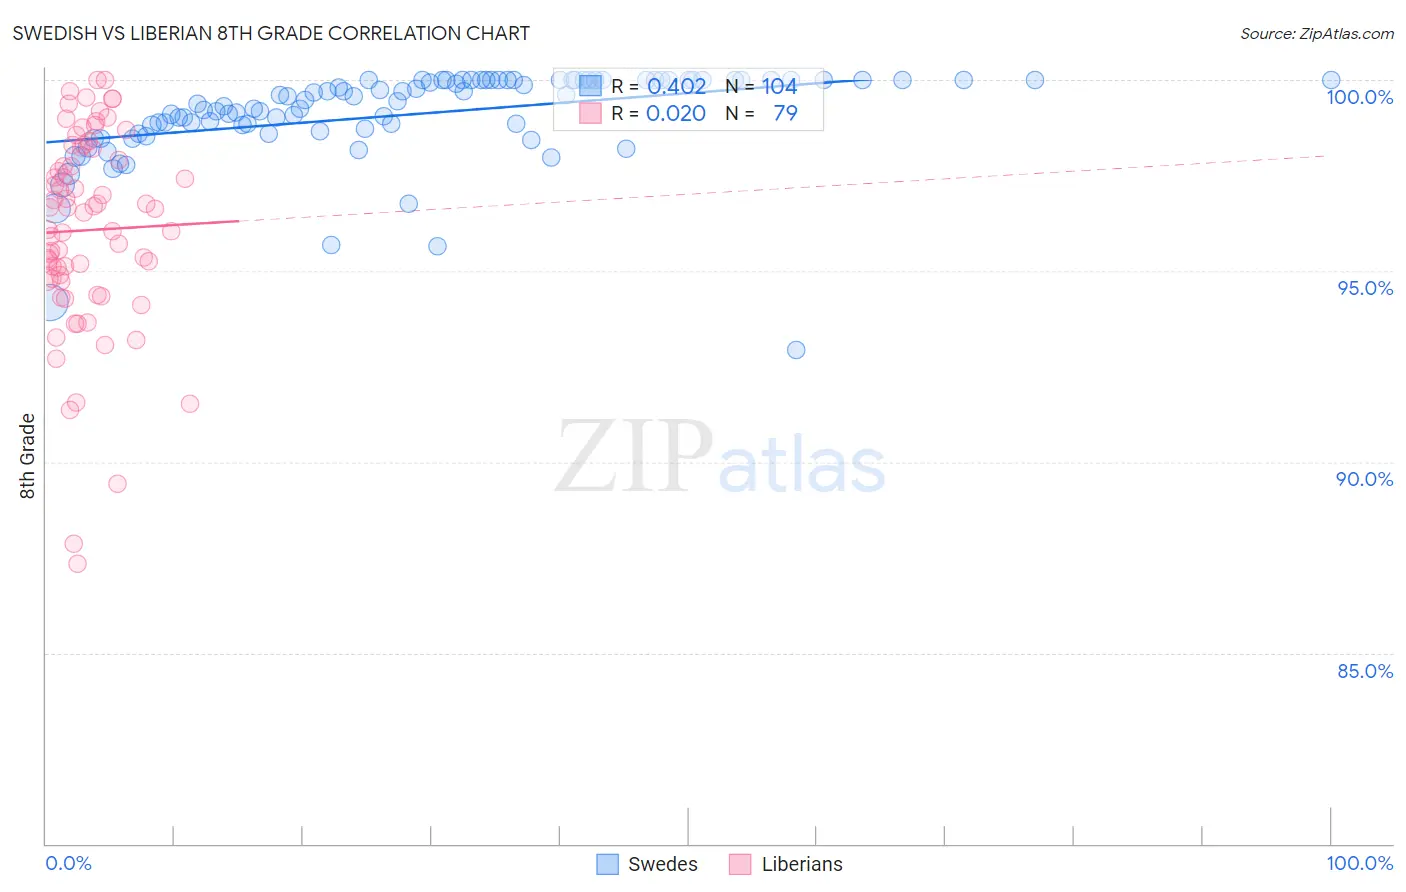
Swedish vs Liberian 8th Grade Correlation Chart
The statistical analysis conducted on geographies consisting of 539,231,492 people shows a moderate positive correlation between the proportion of Swedes and percentage of population with at least 8th grade education in the United States with a correlation coefficient (R) of 0.402 and weighted average of 97.4%. Similarly, the statistical analysis conducted on geographies consisting of 118,101,800 people shows no correlation between the proportion of Liberians and percentage of population with at least 8th grade education in the United States with a correlation coefficient (R) of 0.020 and weighted average of 95.6%, a difference of 1.9%.
8th Grade Correlation Summary
| Measurement | Swedish | Liberian |
| Minimum | 92.9% | 87.3% |
| Maximum | 100.0% | 100.0% |
| Range | 7.1% | 12.7% |
| Mean | 99.1% | 96.1% |
| Median | 99.5% | 96.5% |
| Interquartile 25% (IQ1) | 98.7% | 94.8% |
| Interquartile 75% (IQ3) | 100.0% | 98.2% |
| Interquartile Range (IQR) | 1.3% | 3.4% |
| Standard Deviation (Sample) | 1.2% | 2.6% |
| Standard Deviation (Population) | 1.2% | 2.6% |
Similar Demographics by 8th Grade
Demographics Similar to Swedes by 8th Grade
In terms of 8th grade, the demographic groups most similar to Swedes are Polish (97.4%, a difference of 0.030%), Slovene (97.5%, a difference of 0.060%), Alaskan Athabascan (97.3%, a difference of 0.070%), English (97.3%, a difference of 0.070%), and Pennsylvania German (97.3%, a difference of 0.080%).
| Demographics | Rating | Rank | 8th Grade |
| Ottawa | 100.0 /100 | #5 | Exceptional 97.9% |
| Dutch | 100.0 /100 | #6 | Exceptional 97.7% |
| Norwegians | 100.0 /100 | #7 | Exceptional 97.6% |
| Slovaks | 100.0 /100 | #8 | Exceptional 97.6% |
| Germans | 100.0 /100 | #9 | Exceptional 97.5% |
| Slovenes | 100.0 /100 | #10 | Exceptional 97.5% |
| Poles | 100.0 /100 | #11 | Exceptional 97.4% |
| Swedes | 100.0 /100 | #12 | Exceptional 97.4% |
| Alaskan Athabascans | 100.0 /100 | #13 | Exceptional 97.3% |
| English | 100.0 /100 | #14 | Exceptional 97.3% |
| Pennsylvania Germans | 100.0 /100 | #15 | Exceptional 97.3% |
| Tlingit-Haida | 100.0 /100 | #16 | Exceptional 97.3% |
| Irish | 100.0 /100 | #17 | Exceptional 97.3% |
| Lithuanians | 100.0 /100 | #18 | Exceptional 97.3% |
| Scottish | 100.0 /100 | #19 | Exceptional 97.3% |
Demographics Similar to Liberians by 8th Grade
In terms of 8th grade, the demographic groups most similar to Liberians are Sudanese (95.6%, a difference of 0.0%), Immigrants from Micronesia (95.6%, a difference of 0.010%), Immigrants from Venezuela (95.6%, a difference of 0.010%), Black/African American (95.6%, a difference of 0.020%), and Brazilian (95.6%, a difference of 0.020%).
| Demographics | Rating | Rank | 8th Grade |
| Immigrants | Spain | 38.7 /100 | #181 | Fair 95.7% |
| Immigrants | Egypt | 37.9 /100 | #182 | Fair 95.7% |
| Immigrants | Iraq | 36.2 /100 | #183 | Fair 95.6% |
| Immigrants | Uganda | 36.0 /100 | #184 | Fair 95.6% |
| Blacks/African Americans | 34.8 /100 | #185 | Fair 95.6% |
| Brazilians | 34.8 /100 | #186 | Fair 95.6% |
| Sudanese | 33.0 /100 | #187 | Fair 95.6% |
| Liberians | 32.4 /100 | #188 | Fair 95.6% |
| Immigrants | Micronesia | 31.6 /100 | #189 | Fair 95.6% |
| Immigrants | Venezuela | 30.8 /100 | #190 | Fair 95.6% |
| Immigrants | Nepal | 30.2 /100 | #191 | Fair 95.6% |
| Pima | 28.6 /100 | #192 | Fair 95.6% |
| Panamanians | 28.4 /100 | #193 | Fair 95.6% |
| Guamanians/Chamorros | 26.6 /100 | #194 | Fair 95.6% |
| Immigrants | Zaire | 25.2 /100 | #195 | Fair 95.6% |