Swedish vs Slavic 8th Grade
COMPARE
Swedish
Slavic
8th Grade
8th Grade Comparison
Swedes
Slavs
97.4%
8TH GRADE
100.0/ 100
METRIC RATING
12th/ 347
METRIC RANK
96.8%
8TH GRADE
99.9/ 100
METRIC RATING
48th/ 347
METRIC RANK
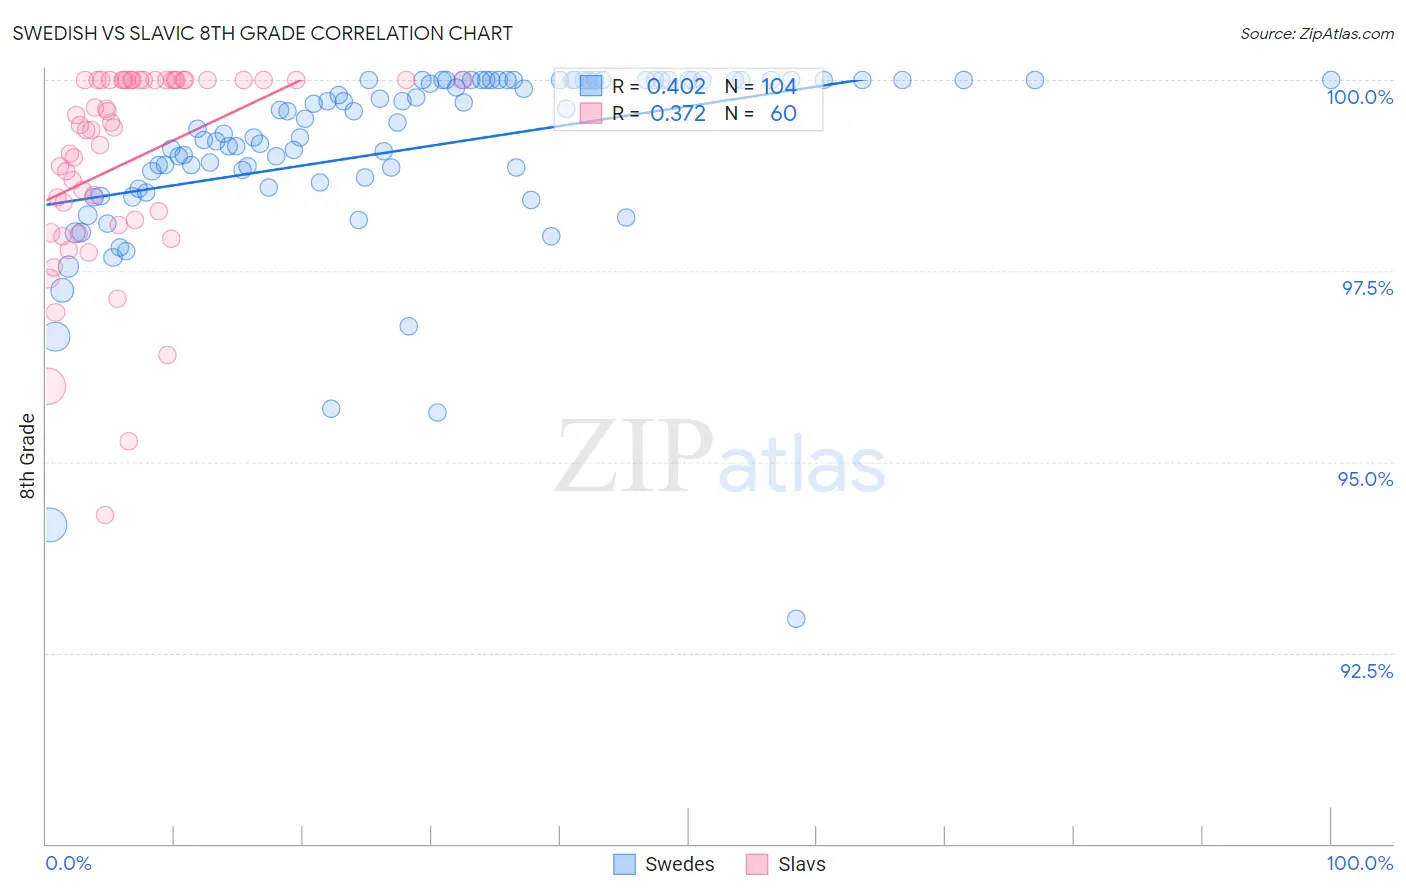
Swedish vs Slavic 8th Grade Correlation Chart
The statistical analysis conducted on geographies consisting of 539,231,492 people shows a moderate positive correlation between the proportion of Swedes and percentage of population with at least 8th grade education in the United States with a correlation coefficient (R) of 0.402 and weighted average of 97.4%. Similarly, the statistical analysis conducted on geographies consisting of 270,869,056 people shows a mild positive correlation between the proportion of Slavs and percentage of population with at least 8th grade education in the United States with a correlation coefficient (R) of 0.372 and weighted average of 96.8%, a difference of 0.60%.
8th Grade Correlation Summary
| Measurement | Swedish | Slavic |
| Minimum | 92.9% | 94.3% |
| Maximum | 100.0% | 100.0% |
| Range | 7.1% | 5.7% |
| Mean | 99.1% | 98.9% |
| Median | 99.5% | 99.4% |
| Interquartile 25% (IQ1) | 98.7% | 98.1% |
| Interquartile 75% (IQ3) | 100.0% | 100.0% |
| Interquartile Range (IQR) | 1.3% | 1.9% |
| Standard Deviation (Sample) | 1.2% | 1.3% |
| Standard Deviation (Population) | 1.2% | 1.3% |
Similar Demographics by 8th Grade
Demographics Similar to Swedes by 8th Grade
In terms of 8th grade, the demographic groups most similar to Swedes are Polish (97.4%, a difference of 0.030%), Slovene (97.5%, a difference of 0.060%), Alaskan Athabascan (97.3%, a difference of 0.070%), English (97.3%, a difference of 0.070%), and Pennsylvania German (97.3%, a difference of 0.080%).
| Demographics | Rating | Rank | 8th Grade |
| Ottawa | 100.0 /100 | #5 | Exceptional 97.9% |
| Dutch | 100.0 /100 | #6 | Exceptional 97.7% |
| Norwegians | 100.0 /100 | #7 | Exceptional 97.6% |
| Slovaks | 100.0 /100 | #8 | Exceptional 97.6% |
| Germans | 100.0 /100 | #9 | Exceptional 97.5% |
| Slovenes | 100.0 /100 | #10 | Exceptional 97.5% |
| Poles | 100.0 /100 | #11 | Exceptional 97.4% |
| Swedes | 100.0 /100 | #12 | Exceptional 97.4% |
| Alaskan Athabascans | 100.0 /100 | #13 | Exceptional 97.3% |
| English | 100.0 /100 | #14 | Exceptional 97.3% |
| Pennsylvania Germans | 100.0 /100 | #15 | Exceptional 97.3% |
| Tlingit-Haida | 100.0 /100 | #16 | Exceptional 97.3% |
| Irish | 100.0 /100 | #17 | Exceptional 97.3% |
| Lithuanians | 100.0 /100 | #18 | Exceptional 97.3% |
| Scottish | 100.0 /100 | #19 | Exceptional 97.3% |
Demographics Similar to Slavs by 8th Grade
In terms of 8th grade, the demographic groups most similar to Slavs are Estonian (96.8%, a difference of 0.010%), Immigrants from Scotland (96.8%, a difference of 0.020%), Bulgarian (96.9%, a difference of 0.030%), Celtic (96.8%, a difference of 0.030%), and Czechoslovakian (96.9%, a difference of 0.040%).
| Demographics | Rating | Rank | 8th Grade |
| Eastern Europeans | 100.0 /100 | #41 | Exceptional 97.0% |
| Chinese | 100.0 /100 | #42 | Exceptional 96.9% |
| Aleuts | 99.9 /100 | #43 | Exceptional 96.9% |
| Maltese | 99.9 /100 | #44 | Exceptional 96.9% |
| Northern Europeans | 99.9 /100 | #45 | Exceptional 96.9% |
| Czechoslovakians | 99.9 /100 | #46 | Exceptional 96.9% |
| Bulgarians | 99.9 /100 | #47 | Exceptional 96.9% |
| Slavs | 99.9 /100 | #48 | Exceptional 96.8% |
| Estonians | 99.9 /100 | #49 | Exceptional 96.8% |
| Immigrants | Scotland | 99.9 /100 | #50 | Exceptional 96.8% |
| Celtics | 99.9 /100 | #51 | Exceptional 96.8% |
| Greeks | 99.9 /100 | #52 | Exceptional 96.8% |
| Austrians | 99.9 /100 | #53 | Exceptional 96.7% |
| Serbians | 99.8 /100 | #54 | Exceptional 96.7% |
| Russians | 99.8 /100 | #55 | Exceptional 96.7% |