Northern European vs Immigrants from Norway Bachelor's Degree
COMPARE
Northern European
Immigrants from Norway
Bachelor's Degree
Bachelor's Degree Comparison
Northern Europeans
Immigrants from Norway
41.0%
BACHELOR'S DEGREE
96.8/ 100
METRIC RATING
107th/ 347
METRIC RANK
44.5%
BACHELOR'S DEGREE
99.9/ 100
METRIC RATING
49th/ 347
METRIC RANK
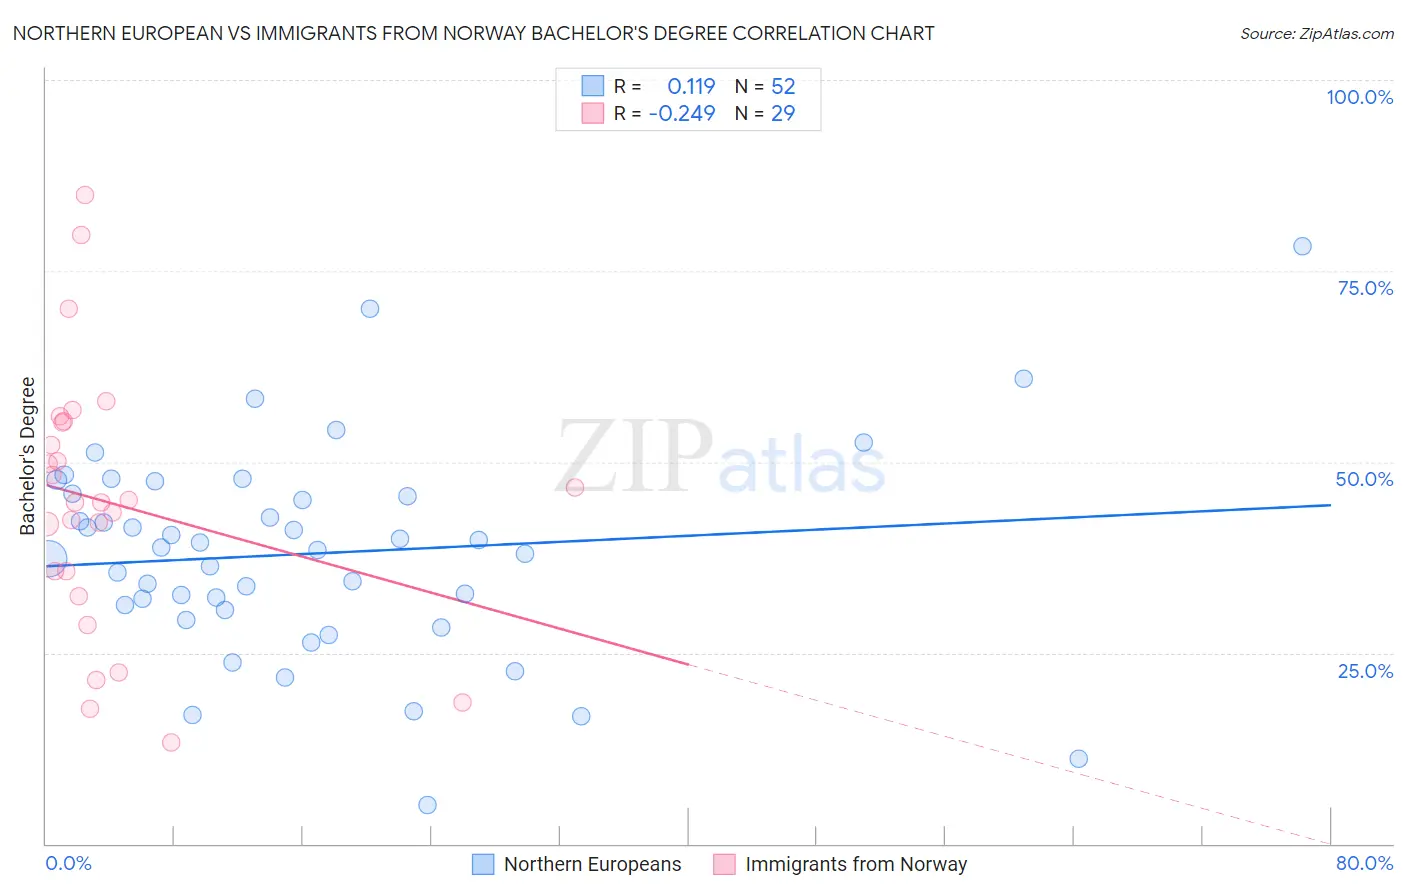
Northern European vs Immigrants from Norway Bachelor's Degree Correlation Chart
The statistical analysis conducted on geographies consisting of 406,072,770 people shows a poor positive correlation between the proportion of Northern Europeans and percentage of population with at least bachelor's degree education in the United States with a correlation coefficient (R) of 0.119 and weighted average of 41.0%. Similarly, the statistical analysis conducted on geographies consisting of 116,713,560 people shows a weak negative correlation between the proportion of Immigrants from Norway and percentage of population with at least bachelor's degree education in the United States with a correlation coefficient (R) of -0.249 and weighted average of 44.5%, a difference of 8.6%.
Bachelor's Degree Correlation Summary
| Measurement | Northern European | Immigrants from Norway |
| Minimum | 5.1% | 13.2% |
| Maximum | 78.2% | 84.9% |
| Range | 73.1% | 71.7% |
| Mean | 38.0% | 44.6% |
| Median | 38.6% | 44.8% |
| Interquartile 25% (IQ1) | 30.9% | 34.0% |
| Interquartile 75% (IQ3) | 45.6% | 55.3% |
| Interquartile Range (IQR) | 14.7% | 21.2% |
| Standard Deviation (Sample) | 13.7% | 17.2% |
| Standard Deviation (Population) | 13.5% | 16.9% |
Similar Demographics by Bachelor's Degree
Demographics Similar to Northern Europeans by Bachelor's Degree
In terms of bachelor's degree, the demographic groups most similar to Northern Europeans are Ukrainian (40.9%, a difference of 0.14%), Arab (40.9%, a difference of 0.16%), Alsatian (41.0%, a difference of 0.17%), Albanian (40.9%, a difference of 0.24%), and Immigrants from Chile (40.8%, a difference of 0.28%).
| Demographics | Rating | Rank | Bachelor's Degree |
| Macedonians | 98.1 /100 | #100 | Exceptional 41.4% |
| Immigrants | Morocco | 98.0 /100 | #101 | Exceptional 41.4% |
| Immigrants | Italy | 97.8 /100 | #102 | Exceptional 41.3% |
| Chileans | 97.5 /100 | #103 | Exceptional 41.2% |
| Jordanians | 97.4 /100 | #104 | Exceptional 41.2% |
| Syrians | 97.4 /100 | #105 | Exceptional 41.1% |
| Alsatians | 97.0 /100 | #106 | Exceptional 41.0% |
| Northern Europeans | 96.8 /100 | #107 | Exceptional 41.0% |
| Ukrainians | 96.6 /100 | #108 | Exceptional 40.9% |
| Arabs | 96.6 /100 | #109 | Exceptional 40.9% |
| Albanians | 96.5 /100 | #110 | Exceptional 40.9% |
| Immigrants | Chile | 96.4 /100 | #111 | Exceptional 40.8% |
| Ugandans | 96.3 /100 | #112 | Exceptional 40.8% |
| Brazilians | 96.3 /100 | #113 | Exceptional 40.8% |
| Afghans | 96.2 /100 | #114 | Exceptional 40.8% |
Demographics Similar to Immigrants from Norway by Bachelor's Degree
In terms of bachelor's degree, the demographic groups most similar to Immigrants from Norway are Bolivian (44.6%, a difference of 0.12%), Estonian (44.6%, a difference of 0.12%), Immigrants from Greece (44.5%, a difference of 0.12%), Immigrants from Bulgaria (44.6%, a difference of 0.16%), and Immigrants from Kuwait (44.6%, a difference of 0.22%).
| Demographics | Rating | Rank | Bachelor's Degree |
| Immigrants | Saudi Arabia | 100.0 /100 | #42 | Exceptional 44.8% |
| Immigrants | South Africa | 99.9 /100 | #43 | Exceptional 44.8% |
| Immigrants | Lithuania | 99.9 /100 | #44 | Exceptional 44.6% |
| Immigrants | Kuwait | 99.9 /100 | #45 | Exceptional 44.6% |
| Immigrants | Bulgaria | 99.9 /100 | #46 | Exceptional 44.6% |
| Bolivians | 99.9 /100 | #47 | Exceptional 44.6% |
| Estonians | 99.9 /100 | #48 | Exceptional 44.6% |
| Immigrants | Norway | 99.9 /100 | #49 | Exceptional 44.5% |
| Immigrants | Greece | 99.9 /100 | #50 | Exceptional 44.5% |
| Asians | 99.9 /100 | #51 | Exceptional 44.4% |
| Immigrants | Spain | 99.9 /100 | #52 | Exceptional 44.3% |
| Immigrants | Asia | 99.9 /100 | #53 | Exceptional 44.3% |
| Immigrants | Austria | 99.9 /100 | #54 | Exceptional 44.2% |
| Immigrants | Bolivia | 99.9 /100 | #55 | Exceptional 44.2% |
| Immigrants | Serbia | 99.9 /100 | #56 | Exceptional 44.1% |