Immigrants from Japan vs Immigrants from Latin America Associate's Degree
COMPARE
Immigrants from Japan
Immigrants from Latin America
Associate's Degree
Associate's Degree Comparison
Immigrants from Japan
Immigrants from Latin America
54.6%
ASSOCIATE'S DEGREE
100.0/ 100
METRIC RATING
22nd/ 347
METRIC RANK
37.9%
ASSOCIATE'S DEGREE
0.0/ 100
METRIC RATING
311th/ 347
METRIC RANK
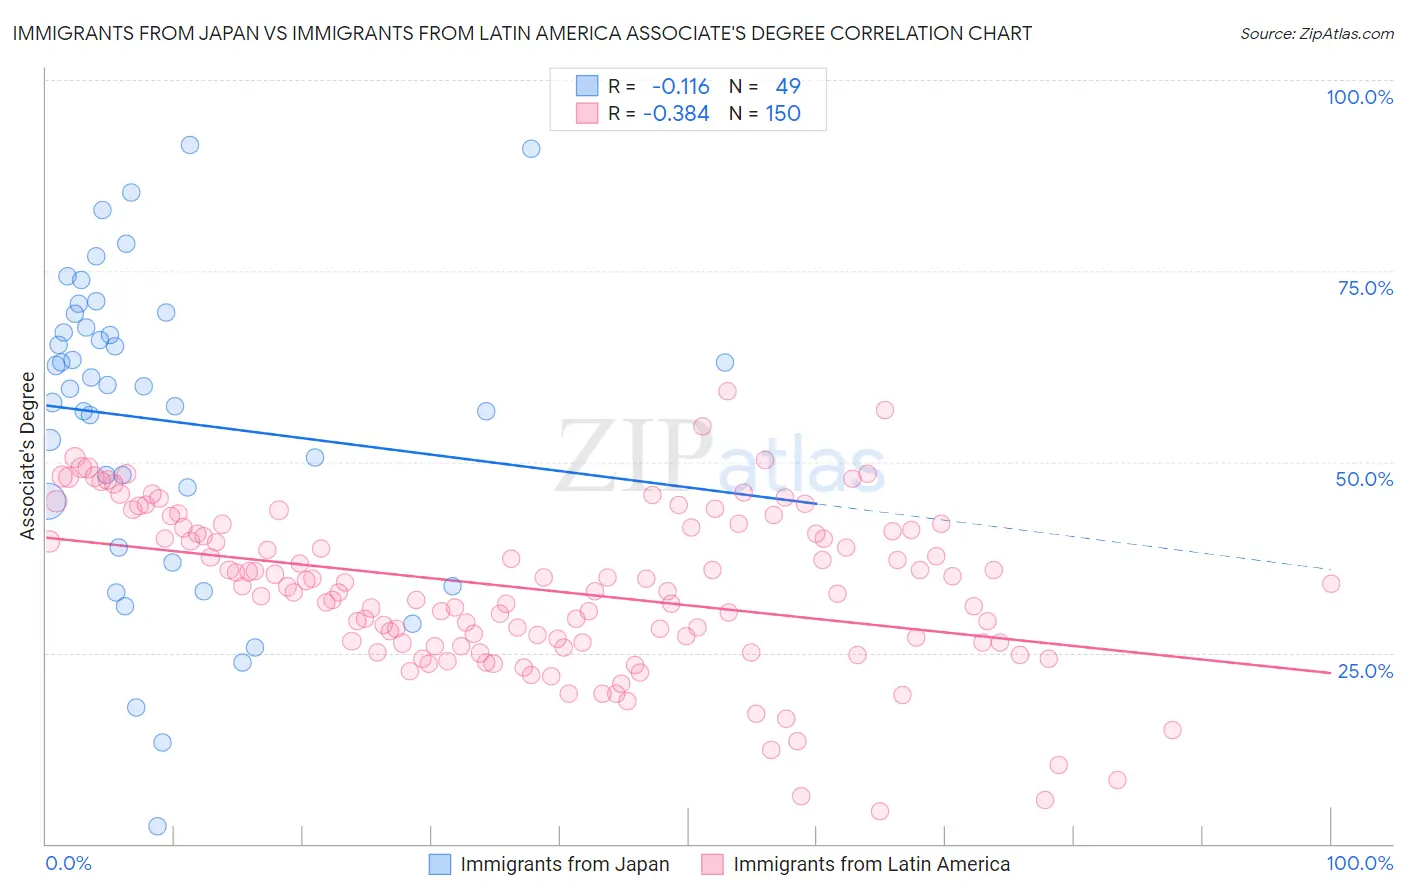
Immigrants from Japan vs Immigrants from Latin America Associate's Degree Correlation Chart
The statistical analysis conducted on geographies consisting of 340,131,347 people shows a poor negative correlation between the proportion of Immigrants from Japan and percentage of population with at least associate's degree education in the United States with a correlation coefficient (R) of -0.116 and weighted average of 54.6%. Similarly, the statistical analysis conducted on geographies consisting of 558,543,762 people shows a mild negative correlation between the proportion of Immigrants from Latin America and percentage of population with at least associate's degree education in the United States with a correlation coefficient (R) of -0.384 and weighted average of 37.9%, a difference of 44.2%.
Associate's Degree Correlation Summary
| Measurement | Immigrants from Japan | Immigrants from Latin America |
| Minimum | 2.2% | 4.2% |
| Maximum | 91.6% | 59.3% |
| Range | 89.3% | 55.1% |
| Mean | 55.5% | 33.3% |
| Median | 60.0% | 33.4% |
| Interquartile 25% (IQ1) | 41.7% | 26.3% |
| Interquartile 75% (IQ3) | 68.5% | 41.3% |
| Interquartile Range (IQR) | 26.8% | 15.0% |
| Standard Deviation (Sample) | 20.1% | 10.6% |
| Standard Deviation (Population) | 19.9% | 10.6% |
Similar Demographics by Associate's Degree
Demographics Similar to Immigrants from Japan by Associate's Degree
In terms of associate's degree, the demographic groups most similar to Immigrants from Japan are Burmese (54.6%, a difference of 0.0%), Immigrants from Sweden (54.6%, a difference of 0.030%), Immigrants from Korea (54.5%, a difference of 0.090%), Cambodian (54.6%, a difference of 0.10%), and Immigrants from Ireland (54.7%, a difference of 0.12%).
| Demographics | Rating | Rank | Associate's Degree |
| Immigrants | Eastern Asia | 100.0 /100 | #15 | Exceptional 55.4% |
| Soviet Union | 100.0 /100 | #16 | Exceptional 55.1% |
| Eastern Europeans | 100.0 /100 | #17 | Exceptional 55.0% |
| Indians (Asian) | 100.0 /100 | #18 | Exceptional 54.8% |
| Immigrants | Ireland | 100.0 /100 | #19 | Exceptional 54.7% |
| Cambodians | 100.0 /100 | #20 | Exceptional 54.6% |
| Immigrants | Sweden | 100.0 /100 | #21 | Exceptional 54.6% |
| Immigrants | Japan | 100.0 /100 | #22 | Exceptional 54.6% |
| Burmese | 100.0 /100 | #23 | Exceptional 54.6% |
| Immigrants | Korea | 100.0 /100 | #24 | Exceptional 54.5% |
| Immigrants | Switzerland | 100.0 /100 | #25 | Exceptional 54.5% |
| Immigrants | Belgium | 100.0 /100 | #26 | Exceptional 54.5% |
| Latvians | 100.0 /100 | #27 | Exceptional 53.9% |
| Turks | 100.0 /100 | #28 | Exceptional 53.9% |
| Immigrants | France | 100.0 /100 | #29 | Exceptional 53.9% |
Demographics Similar to Immigrants from Latin America by Associate's Degree
In terms of associate's degree, the demographic groups most similar to Immigrants from Latin America are Immigrants from Dominican Republic (37.9%, a difference of 0.11%), Choctaw (37.8%, a difference of 0.22%), Hispanic or Latino (37.7%, a difference of 0.37%), Seminole (37.7%, a difference of 0.42%), and Immigrants from Guatemala (38.1%, a difference of 0.73%).
| Demographics | Rating | Rank | Associate's Degree |
| Sioux | 0.0 /100 | #304 | Tragic 38.5% |
| Immigrants | Honduras | 0.0 /100 | #305 | Tragic 38.5% |
| Shoshone | 0.0 /100 | #306 | Tragic 38.4% |
| Immigrants | El Salvador | 0.0 /100 | #307 | Tragic 38.4% |
| Mexican American Indians | 0.0 /100 | #308 | Tragic 38.2% |
| Immigrants | Guatemala | 0.0 /100 | #309 | Tragic 38.1% |
| Immigrants | Dominican Republic | 0.0 /100 | #310 | Tragic 37.9% |
| Immigrants | Latin America | 0.0 /100 | #311 | Tragic 37.9% |
| Choctaw | 0.0 /100 | #312 | Tragic 37.8% |
| Hispanics or Latinos | 0.0 /100 | #313 | Tragic 37.7% |
| Seminole | 0.0 /100 | #314 | Tragic 37.7% |
| Creek | 0.0 /100 | #315 | Tragic 37.6% |
| Crow | 0.0 /100 | #316 | Tragic 37.6% |
| Yaqui | 0.0 /100 | #317 | Tragic 37.6% |
| Alaska Natives | 0.0 /100 | #318 | Tragic 37.5% |