Immigrants from Serbia vs Houma 9th Grade
COMPARE
Immigrants from Serbia
Houma
9th Grade
9th Grade Comparison
Immigrants from Serbia
Houma
95.4%
9TH GRADE
94.4/ 100
METRIC RATING
126th/ 347
METRIC RANK
92.3%
9TH GRADE
0.0/ 100
METRIC RATING
312th/ 347
METRIC RANK
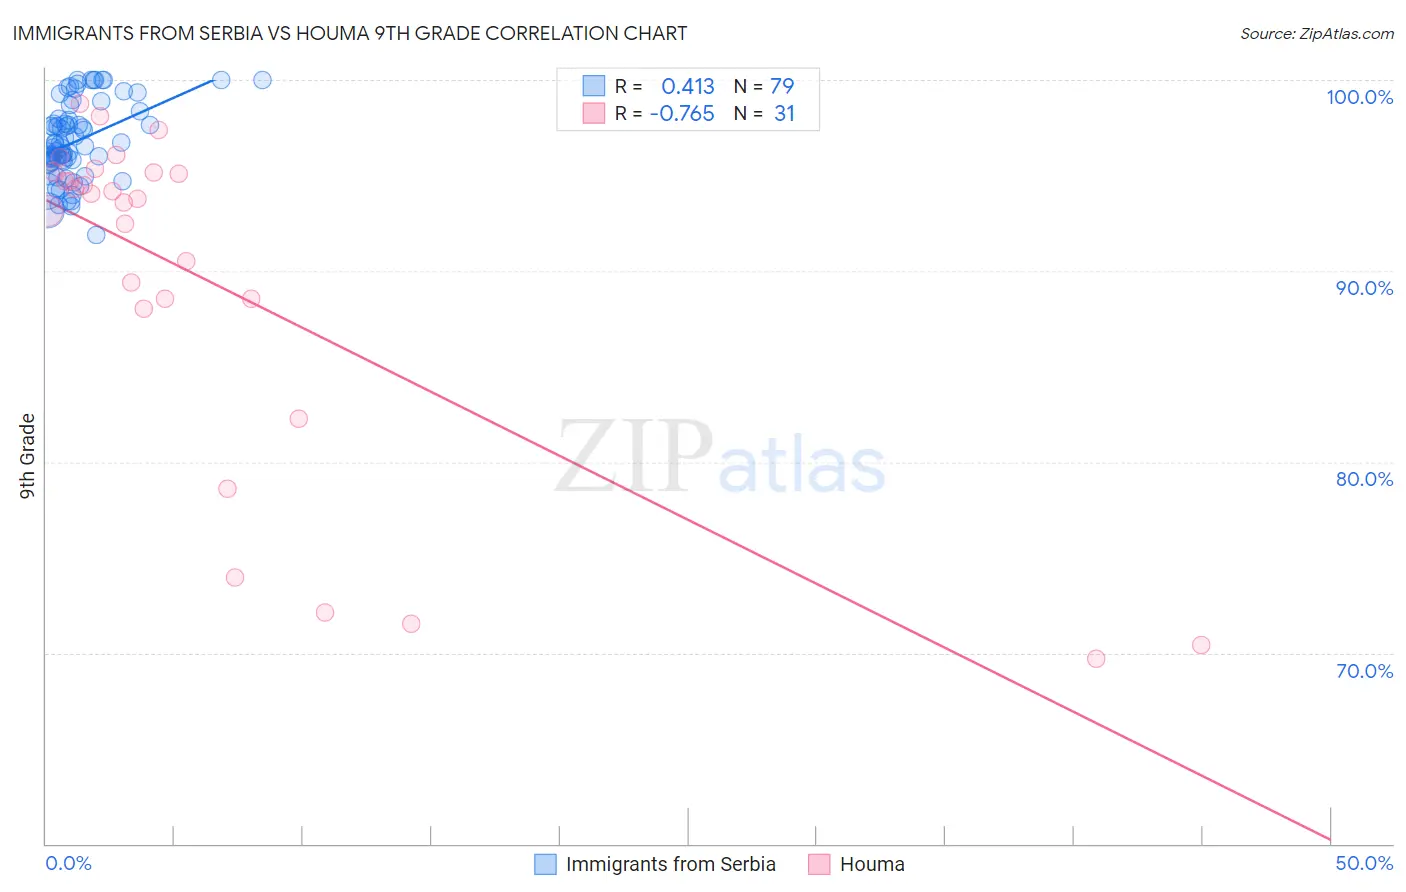
Immigrants from Serbia vs Houma 9th Grade Correlation Chart
The statistical analysis conducted on geographies consisting of 131,729,423 people shows a moderate positive correlation between the proportion of Immigrants from Serbia and percentage of population with at least 9th grade education in the United States with a correlation coefficient (R) of 0.413 and weighted average of 95.4%. Similarly, the statistical analysis conducted on geographies consisting of 36,795,916 people shows a strong negative correlation between the proportion of Houma and percentage of population with at least 9th grade education in the United States with a correlation coefficient (R) of -0.765 and weighted average of 92.3%, a difference of 3.3%.
9th Grade Correlation Summary
| Measurement | Immigrants from Serbia | Houma |
| Minimum | 91.9% | 69.7% |
| Maximum | 100.0% | 98.8% |
| Range | 8.1% | 29.0% |
| Mean | 96.8% | 89.4% |
| Median | 96.6% | 93.8% |
| Interquartile 25% (IQ1) | 95.7% | 88.0% |
| Interquartile 75% (IQ3) | 98.0% | 95.1% |
| Interquartile Range (IQR) | 2.3% | 7.1% |
| Standard Deviation (Sample) | 2.0% | 9.0% |
| Standard Deviation (Population) | 2.0% | 8.9% |
Similar Demographics by 9th Grade
Demographics Similar to Immigrants from Serbia by 9th Grade
In terms of 9th grade, the demographic groups most similar to Immigrants from Serbia are Palestinian (95.4%, a difference of 0.0%), Immigrants from Hungary (95.4%, a difference of 0.010%), Basque (95.4%, a difference of 0.010%), Immigrants from South Central Asia (95.4%, a difference of 0.020%), and Kiowa (95.4%, a difference of 0.030%).
| Demographics | Rating | Rank | 9th Grade |
| Soviet Union | 95.6 /100 | #119 | Exceptional 95.4% |
| Cambodians | 95.6 /100 | #120 | Exceptional 95.4% |
| Cree | 95.5 /100 | #121 | Exceptional 95.4% |
| Immigrants | Kuwait | 95.5 /100 | #122 | Exceptional 95.4% |
| Kiowa | 95.3 /100 | #123 | Exceptional 95.4% |
| Shoshone | 95.3 /100 | #124 | Exceptional 95.4% |
| Immigrants | South Central Asia | 95.1 /100 | #125 | Exceptional 95.4% |
| Immigrants | Serbia | 94.4 /100 | #126 | Exceptional 95.4% |
| Palestinians | 94.3 /100 | #127 | Exceptional 95.4% |
| Immigrants | Hungary | 94.2 /100 | #128 | Exceptional 95.4% |
| Basques | 94.1 /100 | #129 | Exceptional 95.4% |
| Jordanians | 93.5 /100 | #130 | Exceptional 95.3% |
| Immigrants | North Macedonia | 92.3 /100 | #131 | Exceptional 95.3% |
| Immigrants | Nonimmigrants | 92.0 /100 | #132 | Exceptional 95.3% |
| Israelis | 90.4 /100 | #133 | Exceptional 95.3% |
Demographics Similar to Houma by 9th Grade
In terms of 9th grade, the demographic groups most similar to Houma are Vietnamese (92.3%, a difference of 0.020%), Immigrants from Fiji (92.3%, a difference of 0.030%), Immigrants from Cambodia (92.4%, a difference of 0.060%), Immigrants from Portugal (92.2%, a difference of 0.060%), and Immigrants from Caribbean (92.2%, a difference of 0.070%).
| Demographics | Rating | Rank | 9th Grade |
| Japanese | 0.0 /100 | #305 | Tragic 92.6% |
| Immigrants | Vietnam | 0.0 /100 | #306 | Tragic 92.6% |
| Immigrants | Immigrants | 0.0 /100 | #307 | Tragic 92.5% |
| Immigrants | Guyana | 0.0 /100 | #308 | Tragic 92.5% |
| Immigrants | Bangladesh | 0.0 /100 | #309 | Tragic 92.4% |
| Immigrants | Cambodia | 0.0 /100 | #310 | Tragic 92.4% |
| Immigrants | Fiji | 0.0 /100 | #311 | Tragic 92.3% |
| Houma | 0.0 /100 | #312 | Tragic 92.3% |
| Vietnamese | 0.0 /100 | #313 | Tragic 92.3% |
| Immigrants | Portugal | 0.0 /100 | #314 | Tragic 92.2% |
| Immigrants | Caribbean | 0.0 /100 | #315 | Tragic 92.2% |
| Cape Verdeans | 0.0 /100 | #316 | Tragic 92.2% |
| Immigrants | Cuba | 0.0 /100 | #317 | Tragic 92.2% |
| Nepalese | 0.0 /100 | #318 | Tragic 92.0% |
| Ecuadorians | 0.0 /100 | #319 | Tragic 91.9% |