Immigrants from Fiji vs Hopi Master's Degree
COMPARE
Immigrants from Fiji
Hopi
Master's Degree
Master's Degree Comparison
Immigrants from Fiji
Hopi
12.4%
MASTER'S DEGREE
0.5/ 100
METRIC RATING
265th/ 347
METRIC RANK
10.9%
MASTER'S DEGREE
0.0/ 100
METRIC RATING
317th/ 347
METRIC RANK
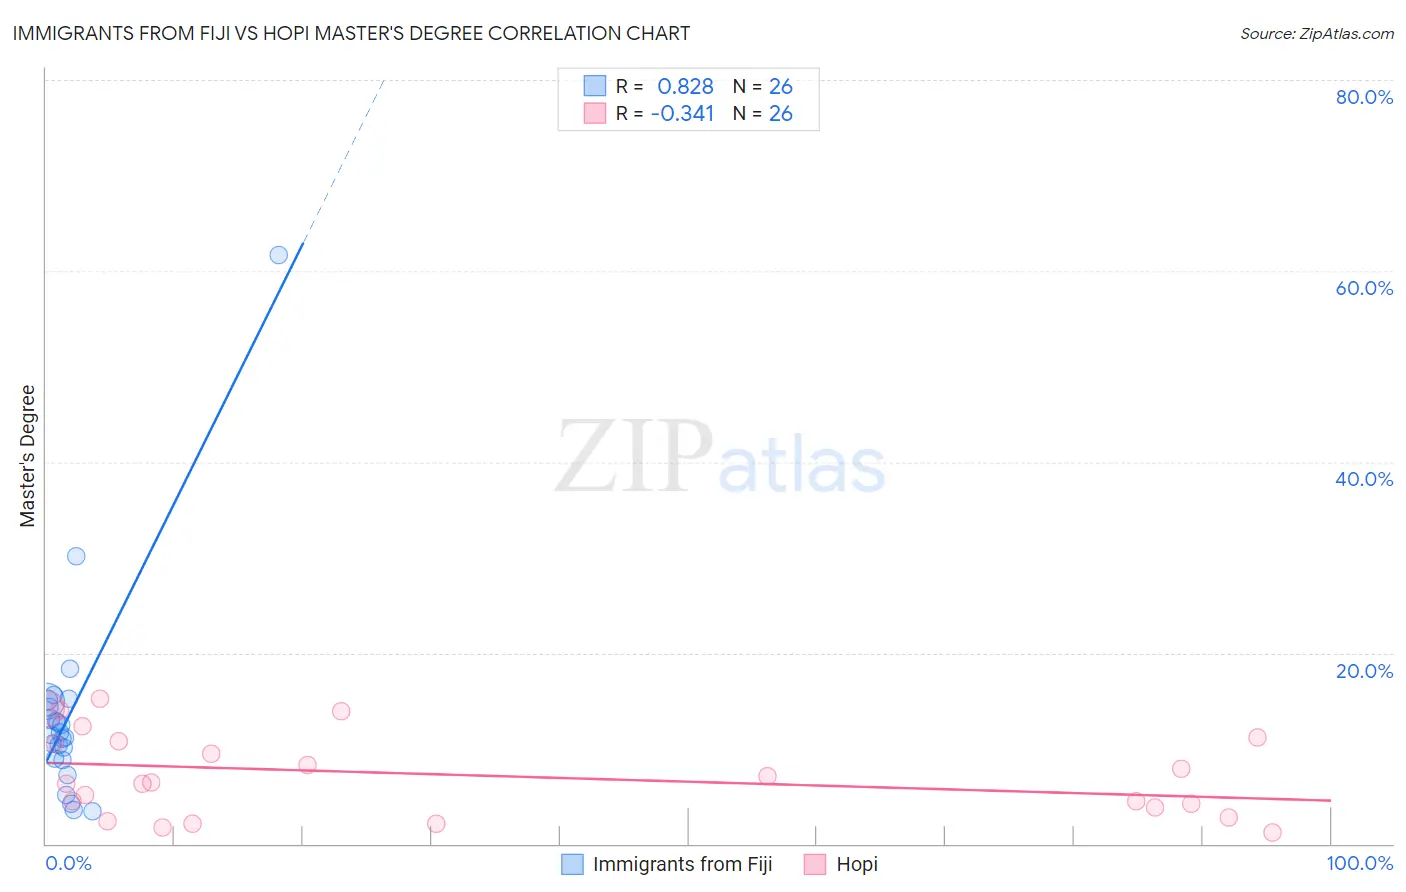
Immigrants from Fiji vs Hopi Master's Degree Correlation Chart
The statistical analysis conducted on geographies consisting of 93,754,667 people shows a very strong positive correlation between the proportion of Immigrants from Fiji and percentage of population with at least master's degree education in the United States with a correlation coefficient (R) of 0.828 and weighted average of 12.4%. Similarly, the statistical analysis conducted on geographies consisting of 74,729,525 people shows a mild negative correlation between the proportion of Hopi and percentage of population with at least master's degree education in the United States with a correlation coefficient (R) of -0.341 and weighted average of 10.9%, a difference of 14.2%.
Master's Degree Correlation Summary
| Measurement | Immigrants from Fiji | Hopi |
| Minimum | 3.5% | 1.1% |
| Maximum | 61.7% | 15.2% |
| Range | 58.2% | 14.1% |
| Mean | 13.6% | 7.2% |
| Median | 11.5% | 6.3% |
| Interquartile 25% (IQ1) | 8.9% | 3.7% |
| Interquartile 75% (IQ3) | 14.9% | 10.8% |
| Interquartile Range (IQR) | 6.0% | 7.0% |
| Standard Deviation (Sample) | 11.2% | 4.4% |
| Standard Deviation (Population) | 11.0% | 4.3% |
Similar Demographics by Master's Degree
Demographics Similar to Immigrants from Fiji by Master's Degree
In terms of master's degree, the demographic groups most similar to Immigrants from Fiji are Belizean (12.4%, a difference of 0.020%), Bahamian (12.4%, a difference of 0.16%), Central American Indian (12.4%, a difference of 0.19%), Nicaraguan (12.5%, a difference of 0.42%), and Tongan (12.5%, a difference of 0.61%).
| Demographics | Rating | Rank | Master's Degree |
| Immigrants | Liberia | 0.6 /100 | #258 | Tragic 12.5% |
| Japanese | 0.6 /100 | #259 | Tragic 12.5% |
| Dominicans | 0.6 /100 | #260 | Tragic 12.5% |
| Tongans | 0.6 /100 | #261 | Tragic 12.5% |
| Nicaraguans | 0.6 /100 | #262 | Tragic 12.5% |
| Central American Indians | 0.5 /100 | #263 | Tragic 12.4% |
| Belizeans | 0.5 /100 | #264 | Tragic 12.4% |
| Immigrants | Fiji | 0.5 /100 | #265 | Tragic 12.4% |
| Bahamians | 0.5 /100 | #266 | Tragic 12.4% |
| Americans | 0.4 /100 | #267 | Tragic 12.3% |
| Native Hawaiians | 0.4 /100 | #268 | Tragic 12.3% |
| Central Americans | 0.3 /100 | #269 | Tragic 12.2% |
| Salvadorans | 0.3 /100 | #270 | Tragic 12.2% |
| Haitians | 0.3 /100 | #271 | Tragic 12.1% |
| Comanche | 0.3 /100 | #272 | Tragic 12.1% |
Demographics Similar to Hopi by Master's Degree
In terms of master's degree, the demographic groups most similar to Hopi are Immigrants from Cuba (10.9%, a difference of 0.13%), Kiowa (10.8%, a difference of 0.37%), Hispanic or Latino (10.9%, a difference of 0.54%), Cajun (11.0%, a difference of 0.88%), and Apache (11.0%, a difference of 0.88%).
| Demographics | Rating | Rank | Master's Degree |
| Shoshone | 0.0 /100 | #310 | Tragic 11.1% |
| Seminole | 0.0 /100 | #311 | Tragic 11.0% |
| Choctaw | 0.0 /100 | #312 | Tragic 11.0% |
| Yaqui | 0.0 /100 | #313 | Tragic 11.0% |
| Cajuns | 0.0 /100 | #314 | Tragic 11.0% |
| Apache | 0.0 /100 | #315 | Tragic 11.0% |
| Hispanics or Latinos | 0.0 /100 | #316 | Tragic 10.9% |
| Hopi | 0.0 /100 | #317 | Tragic 10.9% |
| Immigrants | Cuba | 0.0 /100 | #318 | Tragic 10.9% |
| Kiowa | 0.0 /100 | #319 | Tragic 10.8% |
| Immigrants | Micronesia | 0.0 /100 | #320 | Tragic 10.8% |
| Pennsylvania Germans | 0.0 /100 | #321 | Tragic 10.7% |
| Sioux | 0.0 /100 | #322 | Tragic 10.7% |
| Crow | 0.0 /100 | #323 | Tragic 10.6% |
| Dutch West Indians | 0.0 /100 | #324 | Tragic 10.6% |