Sudanese vs Choctaw 8th Grade
COMPARE
Sudanese
Choctaw
8th Grade
8th Grade Comparison
Sudanese
Choctaw
95.6%
8TH GRADE
33.0/ 100
METRIC RATING
187th/ 347
METRIC RANK
96.2%
8TH GRADE
94.0/ 100
METRIC RATING
126th/ 347
METRIC RANK
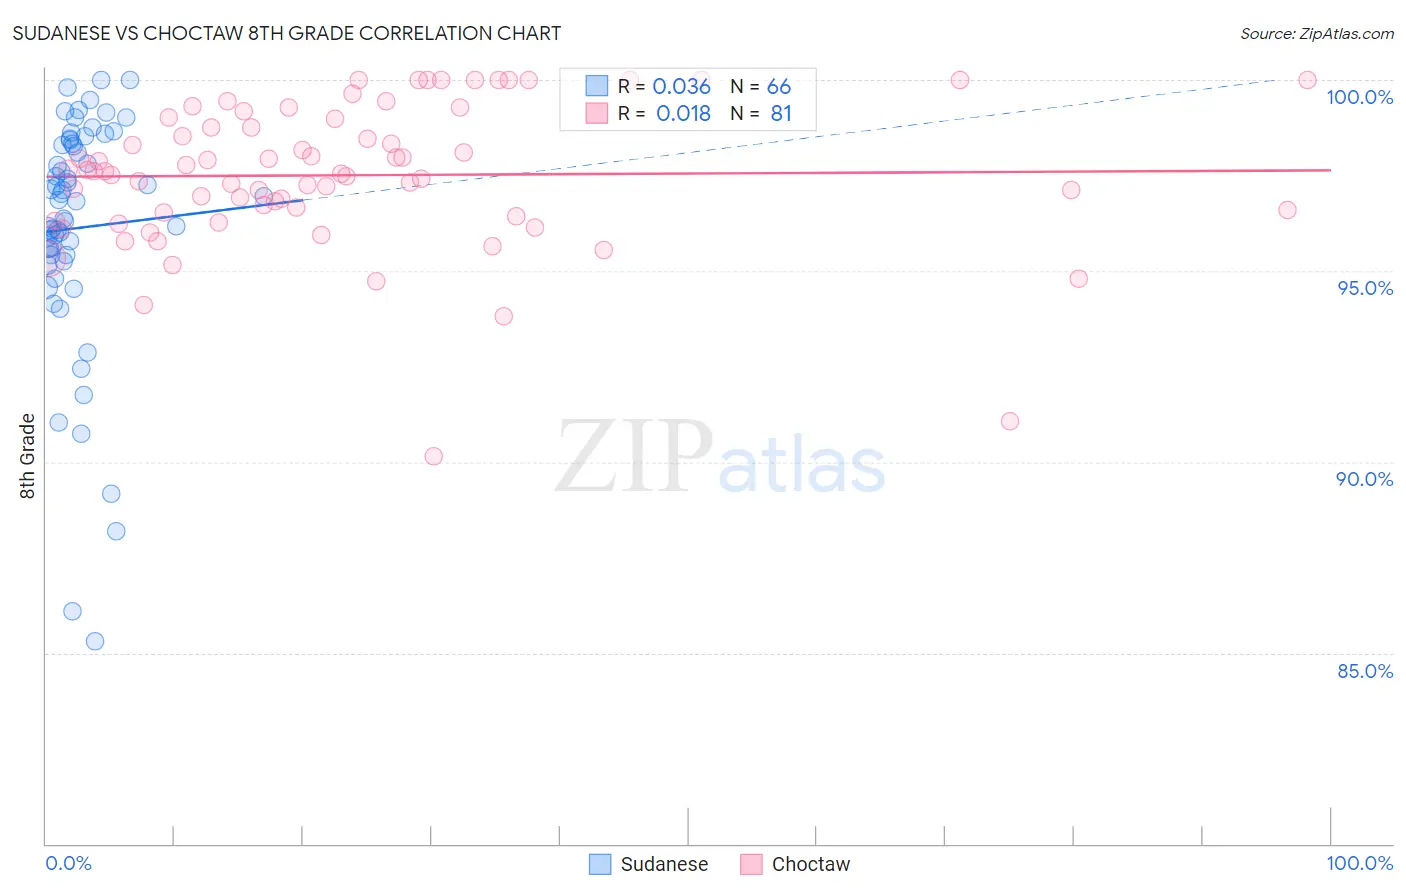
Sudanese vs Choctaw 8th Grade Correlation Chart
The statistical analysis conducted on geographies consisting of 110,124,633 people shows no correlation between the proportion of Sudanese and percentage of population with at least 8th grade education in the United States with a correlation coefficient (R) of 0.036 and weighted average of 95.6%. Similarly, the statistical analysis conducted on geographies consisting of 269,742,875 people shows no correlation between the proportion of Choctaw and percentage of population with at least 8th grade education in the United States with a correlation coefficient (R) of 0.018 and weighted average of 96.2%, a difference of 0.56%.
8th Grade Correlation Summary
| Measurement | Sudanese | Choctaw |
| Minimum | 85.3% | 90.2% |
| Maximum | 100.0% | 100.0% |
| Range | 14.7% | 9.8% |
| Mean | 96.1% | 97.5% |
| Median | 96.8% | 97.6% |
| Interquartile 25% (IQ1) | 95.4% | 96.5% |
| Interquartile 75% (IQ3) | 98.3% | 99.0% |
| Interquartile Range (IQR) | 2.9% | 2.5% |
| Standard Deviation (Sample) | 3.1% | 1.9% |
| Standard Deviation (Population) | 3.1% | 1.9% |
Similar Demographics by 8th Grade
Demographics Similar to Sudanese by 8th Grade
In terms of 8th grade, the demographic groups most similar to Sudanese are Liberian (95.6%, a difference of 0.0%), Black/African American (95.6%, a difference of 0.010%), Brazilian (95.6%, a difference of 0.010%), Immigrants from Micronesia (95.6%, a difference of 0.010%), and Immigrants from Iraq (95.6%, a difference of 0.020%).
| Demographics | Rating | Rank | 8th Grade |
| Iraqis | 40.5 /100 | #180 | Average 95.7% |
| Immigrants | Spain | 38.7 /100 | #181 | Fair 95.7% |
| Immigrants | Egypt | 37.9 /100 | #182 | Fair 95.7% |
| Immigrants | Iraq | 36.2 /100 | #183 | Fair 95.6% |
| Immigrants | Uganda | 36.0 /100 | #184 | Fair 95.6% |
| Blacks/African Americans | 34.8 /100 | #185 | Fair 95.6% |
| Brazilians | 34.8 /100 | #186 | Fair 95.6% |
| Sudanese | 33.0 /100 | #187 | Fair 95.6% |
| Liberians | 32.4 /100 | #188 | Fair 95.6% |
| Immigrants | Micronesia | 31.6 /100 | #189 | Fair 95.6% |
| Immigrants | Venezuela | 30.8 /100 | #190 | Fair 95.6% |
| Immigrants | Nepal | 30.2 /100 | #191 | Fair 95.6% |
| Pima | 28.6 /100 | #192 | Fair 95.6% |
| Panamanians | 28.4 /100 | #193 | Fair 95.6% |
| Guamanians/Chamorros | 26.6 /100 | #194 | Fair 95.6% |
Demographics Similar to Choctaw by 8th Grade
In terms of 8th grade, the demographic groups most similar to Choctaw are Immigrants from Romania (96.2%, a difference of 0.0%), Immigrants from Serbia (96.2%, a difference of 0.0%), Immigrants from Bosnia and Herzegovina (96.2%, a difference of 0.0%), Filipino (96.2%, a difference of 0.020%), and Palestinian (96.2%, a difference of 0.020%).
| Demographics | Rating | Rank | 8th Grade |
| Immigrants | Switzerland | 95.3 /100 | #119 | Exceptional 96.2% |
| Immigrants | France | 95.3 /100 | #120 | Exceptional 96.2% |
| Immigrants | Bulgaria | 95.3 /100 | #121 | Exceptional 96.2% |
| Immigrants | Europe | 95.3 /100 | #122 | Exceptional 96.2% |
| Filipinos | 94.6 /100 | #123 | Exceptional 96.2% |
| Palestinians | 94.6 /100 | #124 | Exceptional 96.2% |
| Immigrants | Romania | 94.1 /100 | #125 | Exceptional 96.2% |
| Choctaw | 94.0 /100 | #126 | Exceptional 96.2% |
| Immigrants | Serbia | 94.0 /100 | #127 | Exceptional 96.2% |
| Immigrants | Bosnia and Herzegovina | 93.9 /100 | #128 | Exceptional 96.2% |
| Cheyenne | 93.3 /100 | #129 | Exceptional 96.1% |
| Soviet Union | 92.6 /100 | #130 | Exceptional 96.1% |
| Pueblo | 92.3 /100 | #131 | Exceptional 96.1% |
| Immigrants | Kuwait | 92.2 /100 | #132 | Exceptional 96.1% |
| Immigrants | Turkey | 91.7 /100 | #133 | Exceptional 96.1% |